Side A · Liner notes
Leveraging AI for a Comprehensive History of Bank Runs in the U.S.
Banking · Words by David Brown · Released
Researchers unveil a groundbreaking database utilizing AI to catalog over 3,000 bank run episodes in U.S. history, revealing critical insights into financial instability.
Sergio Correia, Stephan Luck, and Emil Verner have released a significant study that delves into the dynamics of banking crises, seeking to enhance our understanding of bank runs through the innovative use of large language models (LLMs). Their research culminates in the creation of the most extensive database of historical bank runs in U.S. history, drawing from millions of digitized newspaper articles. This resource aims to shed light on how these episodes of financial distress unfolded and their implications.
Understanding the Historical Context of Bank Runs
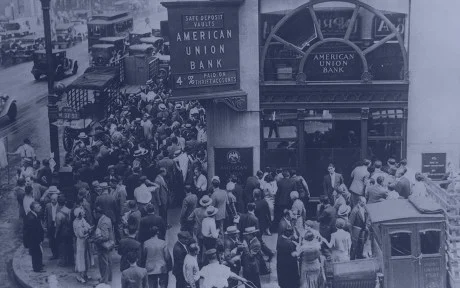
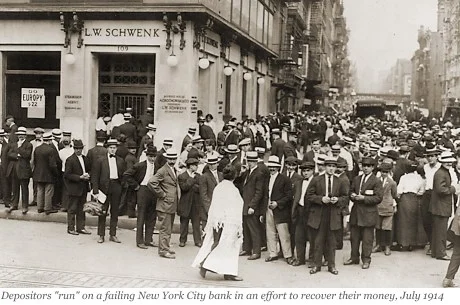
Bank runs have frequently punctuated American economic history, especially through the end of the acute phase of the Great Depression in 1933. However, these events often lack comprehensive documentation in formal records. Traditional regulatory filings, like those from the Office of the Comptroller of the Currency, mainly indicate when banks closed without providing context on potential distress prior to failure. Episodes where banks encountered runs but continued operations typically vanished from regulatory lists, leading to significant knowledge gaps.
Using Newspapers as a Historical Resource
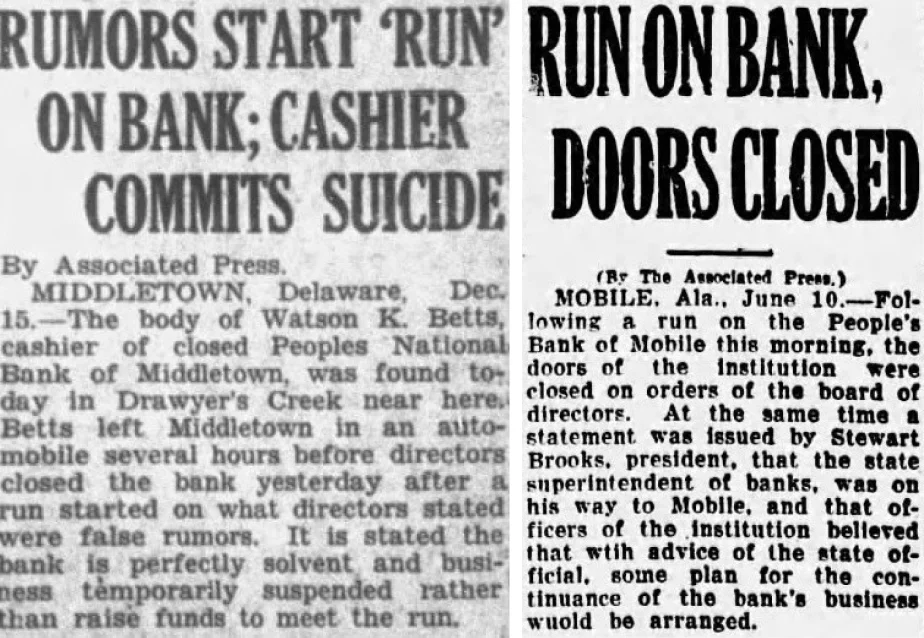
To overcome these challenges, the authors harness information from historical newspapers, utilizing the treasure trove available through the Library of Congress’s Chronicling America project, which has digitized tens of millions of articles. This initiative allows for an unprecedented examination of the narratives surrounding bank runs, which might otherwise go unnoticed due to the limitations of official records.
Data Extraction Methodology
The team extracted data from an initial corpus of over 374 million newspaper articles. They employed a data extraction pipeline, searching for key terms associated with banking distress, such as “bank run,” “deposit withdrawals,” and “suspended.” This keyword search refined their dataset to roughly one million candidate articles.
Next, they employed various LLMs to analyze these articles and extract vital information, such as:

- The banks mentioned
- The nature of the event (i.e., run, suspension, closure, or reopening)
- The timeline of events
- The bank's response to the run
- Factors influencing the run’s occurrence (macro news, adverse bank-specific info, or rumors)
Using LLMs allowed the researchers to contextualize the diverse and rich language of nineteenth-century reporting. This approach mitigates the risk of false positives that arise from simplistic keyword searches, enabling a more nuanced understanding of bank distress as described in the press.

To ensure high data integrity, Correia, Luck, and Verner compared outputs from multiple models and validated results against manually coded samples, confirming the reliability and scalability of their automated method.
The Publicly Accessible Database
The finished database is accessible at www.finhist.com/bank-runs. Users can examine episodes categorized by state, city, year, or type of bank. Each entry links back to the original newspaper sources, inviting both researchers and the public to engage with the historical narratives surrounding these bank runs.

Differentiating Types of Distress Events
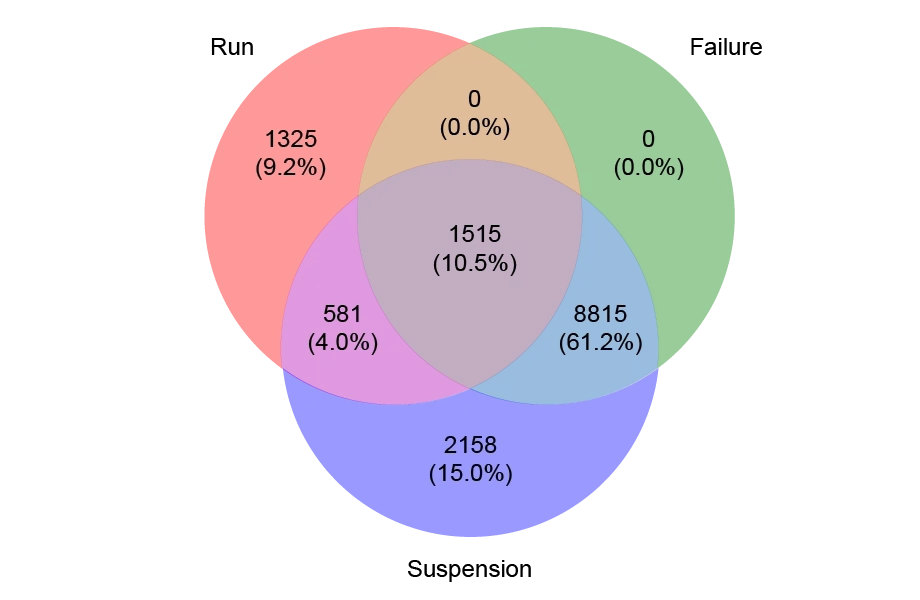
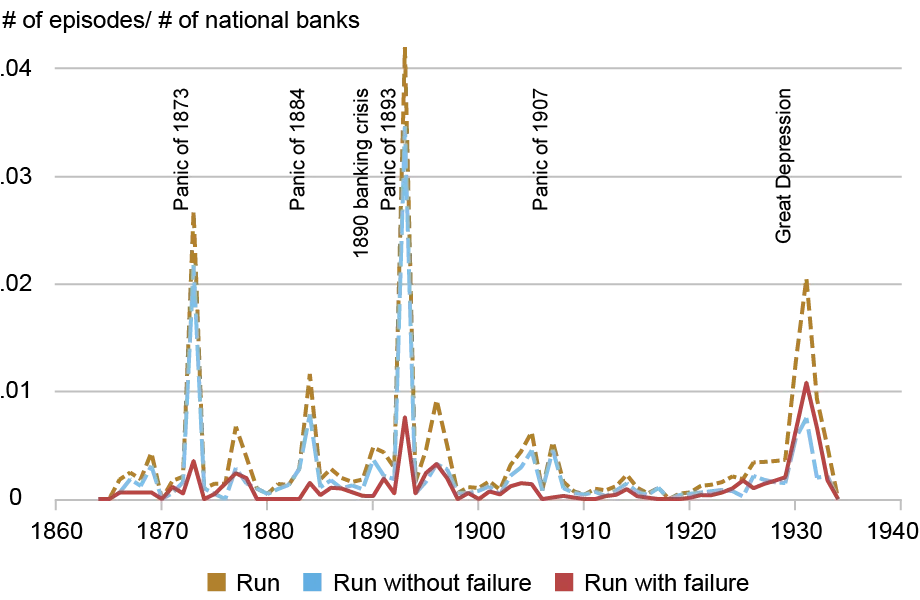
In their analysis, the researchers categorize bank distress events into three categories: bank runs, suspensions, and failures. Their research reveals distinct patterns and relationships among these events. A critical insight is that the majority of bank runs—1,906 large scale instances—did not culminate in bank failures, whereas there are 1,515 runs that did lead to failures. Furthermore, during their examination, the dataset recorded 13,069 suspensions and 10,330 failures.
Temporal Patterns of Bank Runs
The researchers document trends by plotting bank runs as a fraction of the total number of banks yearly from 1863 to 1934. Notably, the data reveals spikes in bank run incidents during economic crises, particularly in 1873, 1884, 1893, 1907, and the Great Depression. This reinforces prevailing narratives regarding crises in the pre-FDIC era, as suggested by previous studies.
Geographical Insights into Bank Runs
The study also visualizes the geographical dynamics of bank runs through an animated map. It illustrates how recessions ripple across the nation, providing critical insights into regional variations. Initially, bank runs were concentrated along the Eastern Seaboard, but as the banking system expanded westward, so did the incidence of distress events. The animated presentation shows that early episodes radiated from New York City, evolving into nationwide phenomena driven by both localized and systemic economic factors.
Future Research Directions and Implications
This database allows researchers to explore myriad aspects of banking crises, facilitating a deeper understanding of when and why runs lead to failures. In a companion post, the authors explore further implications of their findings, considering how historical insights might inform current discussions around banking policies.
By leveraging AI alongside historical data, Correia, Luck, and Verner provide a powerful lens through which to view the multifaceted landscape of bank runs—transforming previously inaccessible records into a robust database that promises to enrich both academic research and public discourse surrounding financial stability.
Through this innovative application, the researchers not only enhance our understanding of banking turmoil in the U.S. but also open avenues for evaluating the implications of past crises on contemporary financial environments.