Side A · Liner notes
U.S. Treasury Trading Dynamics Shift Toward End-of-Day Concentration
Markets · Words by John Rodriguez · Released
U.S. Treasury trading is increasingly concentrated around month-end and the new 4 p.m. index strike time, indicating significant changes in market behavior.
Recent trends in U.S. Treasury trading reveal a marked shift towards greater concentration of activity, particularly on the last trading day of each month. According to a study by Henry Dyer, Michael J. Fleming, and Or Shachar, this uptick in trading volume correlates with changes in index pricing conventions and the scheduling of trading activities.
Increased Trading Volume at Month-End
Analysis shows that U.S. Treasury trading volume spikes dramatically on the final trading day of the month, where it averages about 58 percent higher compared to other days. This is largely due to asset managers adjusting their portfolios relative to fixed-income indexes, which typically rebalance at the month’s end. The researchers highlight that this trend has been growing sharply over the past decade, reinforcing market liquidity during times of heightened trading activity.

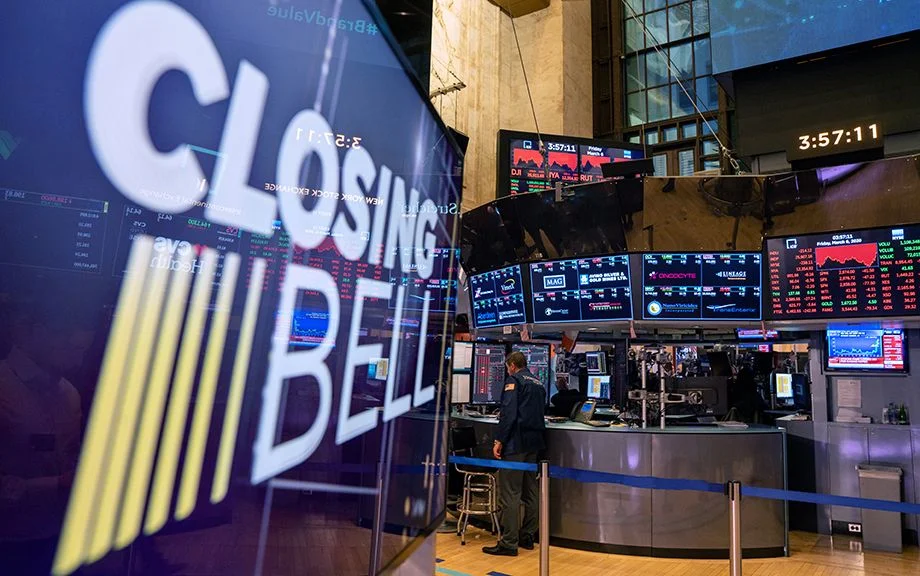
Unlike the stock market, which has a defined closing time, the Treasury market operates over-the-counter (OTC) without a mandated closing hour. Historically, the 3 p.m. mark became standard due to its alignment with open-outcry trading for Treasury futures. However, a significant change occurred on January 14, 2021, when Bloomberg Barclays shifted the strike time for its U.S. dollar-denominated indexes from 3 p.m. to 4 p.m. This adjustment was primarily aimed at minimizing tracking errors for funds that required pricing using 4 p.m. prices.

Methodology for Analyzing Trading Patterns
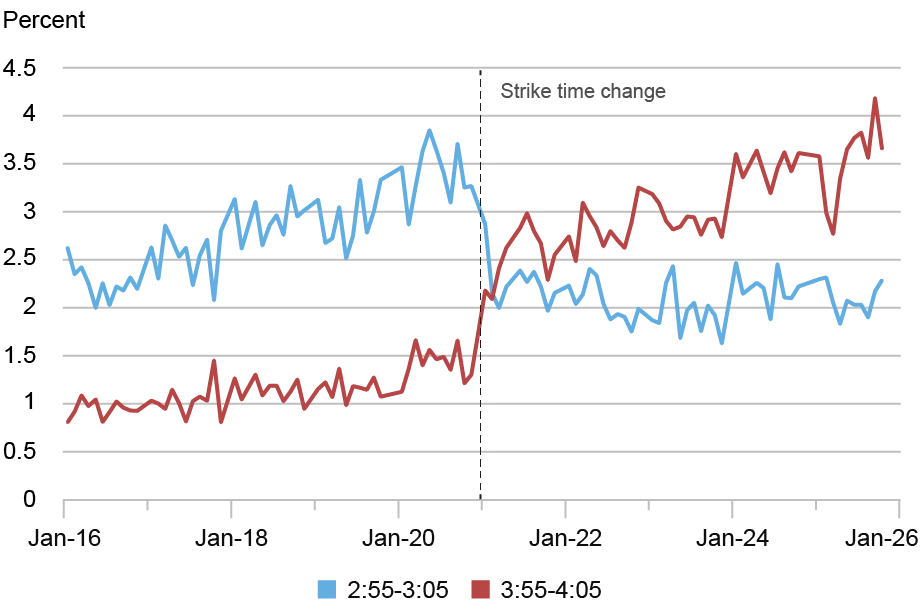
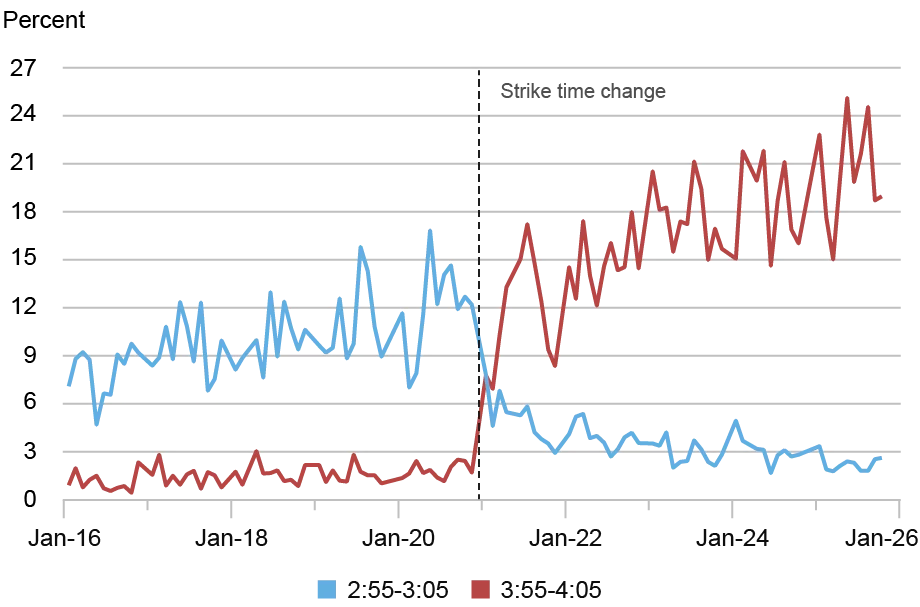
The analysts measured the share of daily trading volume occurring in ten-minute intervals around the 3 p.m. and 4 p.m. index strikes. Their analysis spanned from 2016 to 2025, allowing them to observe not only day-to-day trading fluctuations but also how month-end activities differed from regular trading days. The data focused specifically on the most recent auctioned notes and bonds in the interdealer market, highlighting the dynamics at play.

Shift from 3 p.m. to 4 p.m. Trading
The data clearly indicate a transition in trading volume from the 3 p.m. strike time to 4 p.m. Following the shift instituted by Bloomberg, the share of activity around the old strike time sharply declined. To illustrate, in the years leading up to 2021, the share of daily trading volume at 3 p.m. increased from an average of 2.3 percent in 2016 to 3.4 percent in 2020. Post-change, that share dropped significantly, while 4 p.m. trading saw a rise from 2.5 percent in 2021 to 3.5 percent in 2025.

Impact on Month-End Trading Patterns
On the last trading day of each month, the concentration around these strike times becomes even more significant. The research indicates that on month-end days, the share of trading activity around 3 p.m. grew from an average of 8.1 percent in 2016 to 12.1 percent in 2020, only to plummet following the strike time change. Conversely, the share of trading at 4 p.m. skyrocketed, rising from 11.6 percent in 2021 to an impressive 20.4 percent by 2025. This shift underscores how the timing of index rebalancing can dramatically influence market behavior.

Changes in Intraday Trading Activity
Further analysis reveals a shift in intraday trading patterns as well. In 2016, trading volume displayed spikes corresponding to 8:30 and 10 a.m. macroeconomic announcements, with steady volumes around 3 p.m. and smaller increases noted at 4 p.m. However, by 2025, the pattern shifted significantly; while the 3 p.m. trading levels remained stable, the increase at 4 p.m. became markedly pronounced. The share of trading volume during the interval from 3:10 p.m. to 5:05 p.m. also saw an uptick, especially around the new strike time.

On month-end trading days, the analysis revealed a much larger concentration of volume around the 4 p.m. mark, accounting for over 25 percent of total daily trading volume during that half-hour interval—a dramatic escalation compared to prior years.
Conclusion on Treasury Market Trading Trends
This research reveals a substantial increase in end-of-day trading activities within the U.S. Treasury market, particularly linked to end-of-month index rebalancing. The transformation following the change in strike time from 3 p.m. to 4 p.m. showcases how external factors, like index pricing conventions, can significantly shape trading behaviors. The insights provided here indicate a new normal for trading patterns that market participants will need to consider in their strategies moving forward.
Henry Dyer, currently pursuing a master's in finance at the MIT Sloan School of Management, along with Michael J. Fleming and Or Shachar from the Federal Reserve Bank of New York’s Research and Statistics Group, authored this analysis, highlighting important trends in the Treasury market.