Side A · Liner notes
New York Fed DSGE Model Updates Economic Forecasts for September 2026
Banking · Words by Richard Jones · Released
The New York Fed's DSGE model reflects a more persistent inflation outlook and slight growth revisions for various economic indicators through 2029.

The latest update from the Federal Reserve Bank of New York's dynamic stochastic general equilibrium (DSGE) model presents a nuanced view of the economic landscape as of September 2026. This iteration reflects adjustments in growth projections and inflation expectations, which are significant for stakeholders across the economy, including investors, policymakers, and financial professionals.

GDP Growth Projections
The DSGE model continues to exhibit a cautious stance on economic growth, projecting a GDP growth rate of 1.2 percent for 2026. This forecast aligns with June 2026 estimates but diverges from more optimistic projections from the Philadelphia Fed Survey of Professional Forecasters (SPF), which indicates an anticipated growth rate exceeding 1 percent in annualized terms for Q3 2026. According to DSGE analysts, this discrepancy stems from unexpectedly buoyant financial conditions and a marked AI-driven investment boom. In practice, this means that while some sectors may display increased vitality, the overall growth indicators suggest a less optimistic macroeconomic narrative.
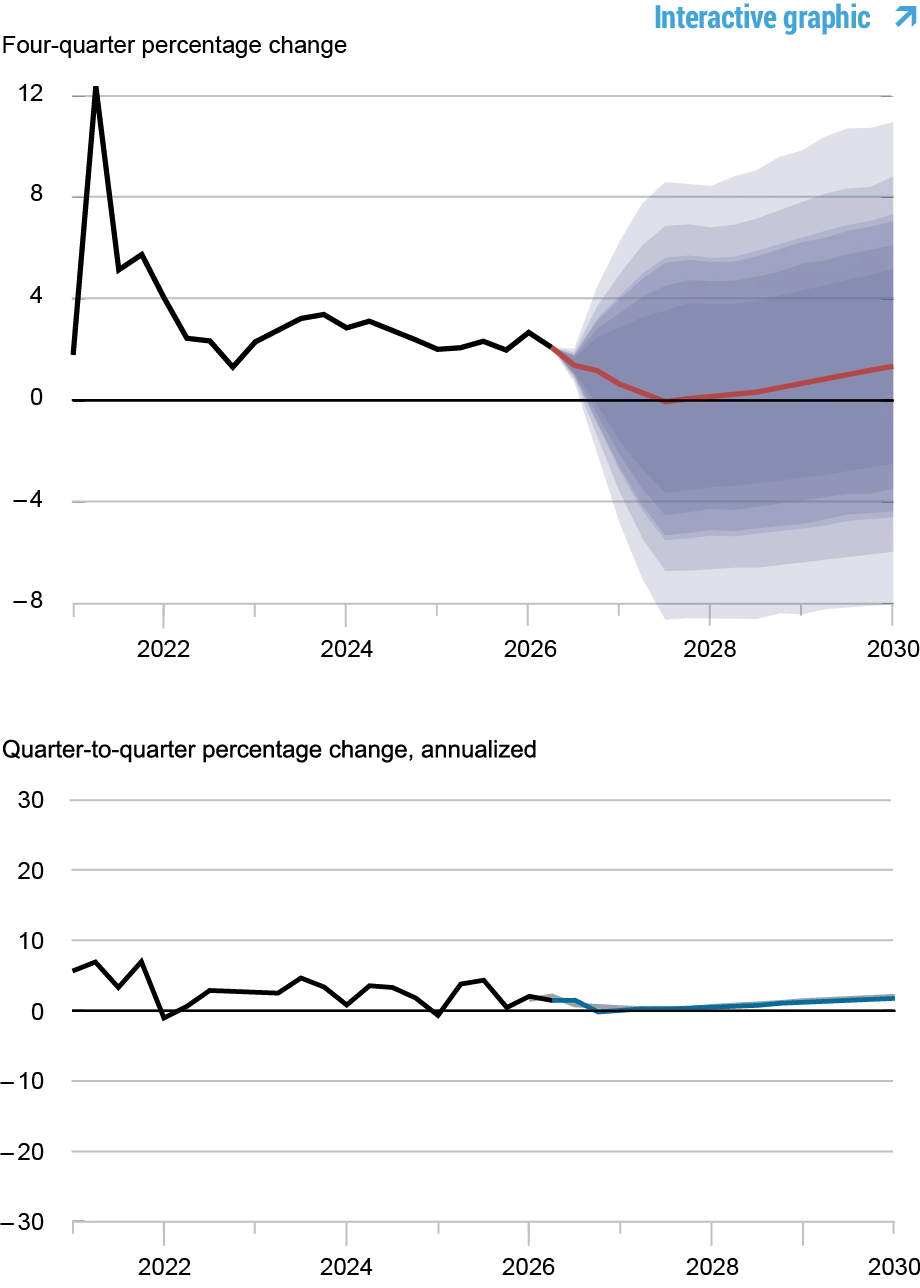
The forecast horizon extending through 2029 starts to look less encouraging. Growth estimates have been slightly adjusted downward. The revised GDP growth rates are now predicted at 0.1 percent for 2027, 0.5 percent for 2028, and 1.2 percent for 2029, compared to earlier June forecasts of 0.2, 0.7, and 1.5 percent, respectively. This shift highlights the model's expectations around tighter monetary policy environments impacting long-term economic expansion. If you're working in this space, these lower projections might make you question the effectiveness of current fiscal and monetary policies. The pullback in productivity growth, particularly total factor productivity (TFP), signals that businesses may not be capitalizing on opportunities as well as anticipated.
Core Inflation Expectations
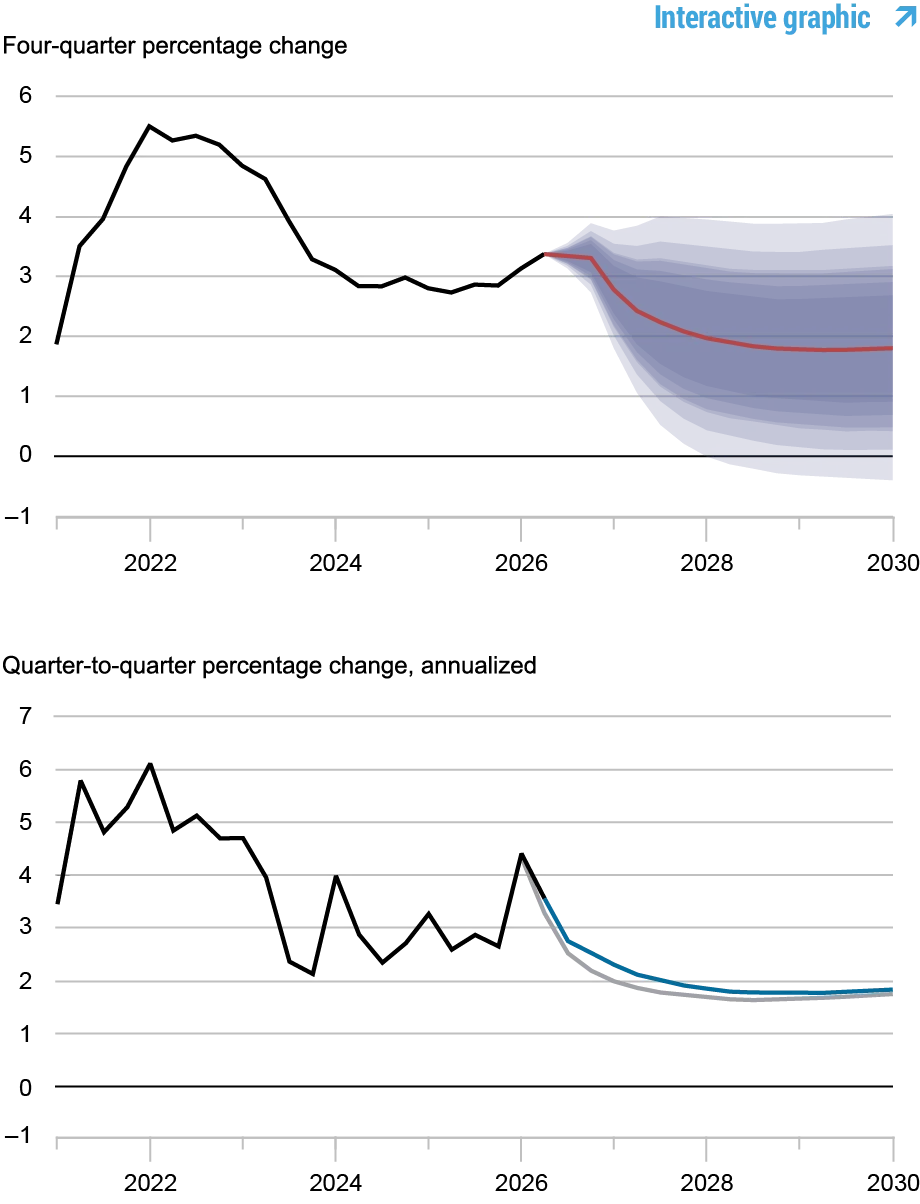
Turning to inflation, the DSGE model's core PCE (Personal Consumption Expenditures) inflation forecasts have also been revised. The projections for 2026 indicate an increase to 3.3 percent from the previous June estimate of 3.1 percent. Subsequently, inflation is expected to moderate, with projected rates dropping to 2.1 percent in 2027, 1.8 percent in 2028, and remaining at 1.8 percent in 2029. This slower path towards the Federal Open Market Committee's long-term objective of 2 percent is attributed to lower TFP growth, suggestive of cost pressures that persist longer than earlier anticipated. Here’s the thing: while inflation expectations are easing slightly in the medium-term, the lingering pressures could keep households and businesses on edge, undermining consumer confidence and spending.
Natural Rate of Interest Adjustments
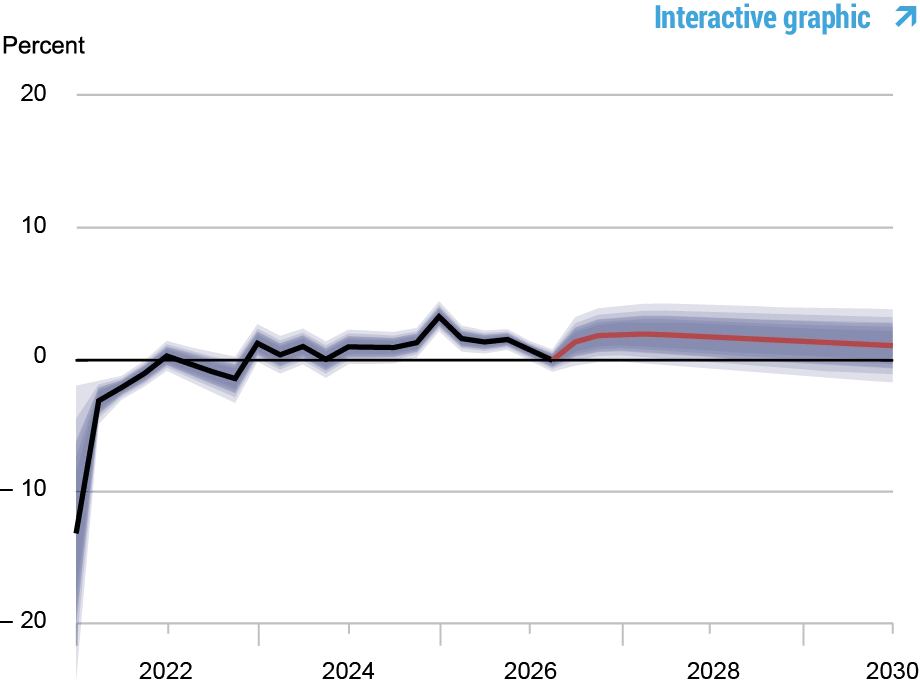
The model's forecast for the real natural rate of interest (r*) signifies a subtle yet notable shift. For 2026, the r* is now projected at 1.9 percent annualized, revised down from 2.0 percent in the previous June forecast. Nevertheless, estimates for subsequent years indicate slight increases—a r* of 1.8 percent in 2027, 1.4 percent in 2028, and 1.2 percent in 2029. These adjustments contrast with predictions from June, which were slightly lower at 1.7, 1.3, and 1.1 percent, respectively. Such shifts in the natural rate have critical implications for interest rate policy. If market rates remain above this natural rate, it can restrain investment and consumer spending, crucial drivers of economic growth.

Forecast Comparison Overview
| Forecast Period | 2026 | 2027 | 2028 | 2029 |
|---|---|---|---|---|
| Date of Forecast | Sep 26 | Jun 26 | Sep 26 | Jun 26 |
| GDP growth (Q4/Q4) | 1.2 (-0.8, 3.1) | 1.2 (-2.2, 4.5) | 0.1 (-5.2, 5.5) | 0.2 (-5.0, 5.2) |
| Core PCE inflation (Q4/Q4) | 3.3 (3.0, 3.7) | 3.1 (2.5, 3.7) | 2.1 (1.0, 3.2) | 1.8 (0.7, 3.0) |
| Real natural rate of interest (Q4) | 1.9 (0.7, 3.1) | 2.0 (0.7, 3.3) | 1.8 (0.4, 3.3) | 1.7 (0.2, 3.1) |
Implications and Considerations
This forecast update is insightful for a range of stakeholders. Investors may recalibrate their strategies based on the updated growth and inflation trajectories. If you’re navigating financial markets, you’ll want to take stock of these trends: a stagnant growth outlook alongside persistent inflation can create headwinds for many sectors. Policymakers will find these predictions relevant for monetary policy considerations, especially in light of the more persistent inflation forecast and the macroeconomic factors influencing consumer spending and investment decisions.

As economic conditions continue to evolve, the New York Fed's DSGE model will be a critical tool in assessing future economic dynamics.

While the DSGE model is not a formal Fed policy forecast, it serves as an important component of economic analysis, incorporating a variety of economic indicators to inform future expectations. This is more significant than it looks. The Fed's analytical models shape expectations and can influence decisions across a spectrum of stakeholders, from Wall Street to Main Street. Observations made today could echo into tomorrow’s economic policy, impacting everything from government spending to individual financial planning.