Side A · Liner notes
Economic Burden of 2025 U.S. Tariffs: Who Actually Pays?
Banking · Words by Thomas Garcia · Released
Nearly 90% of the costs from increased tariffs in 2025 burdened U.S. firms and consumers, highlighting significant shifts in import dynamics.

Throughout 2025, a significant increase in tariff rates on U.S. imports saw the average rate jump from 2.6% to 13%. This remarkable escalation has substantial implications for economic stakeholders in the U.S., as findings indicate that nearly 90% of the tariff burden is shouldered by American firms and consumers. The details below explore the mechanics of these tariffs, their impact on import dynamics, and the resultant economic consequences.

Tariff Rates and Their Monthly Variation
In a thorough review of import tariffs in 2025, data shows that the average statutory tariff rate was particularly low at the beginning of the year. However, this rate sharply increased around April and May when tariffs on Chinese imports were raised by 125 percentage points. The tariffs were then adjusted downward mid-May by 115 percentage points, leading to a year-end average rate of 13%. This fluctuation can be visualized in the monthly tariff rate charts, which highlight how significantly the market has changed over the year.

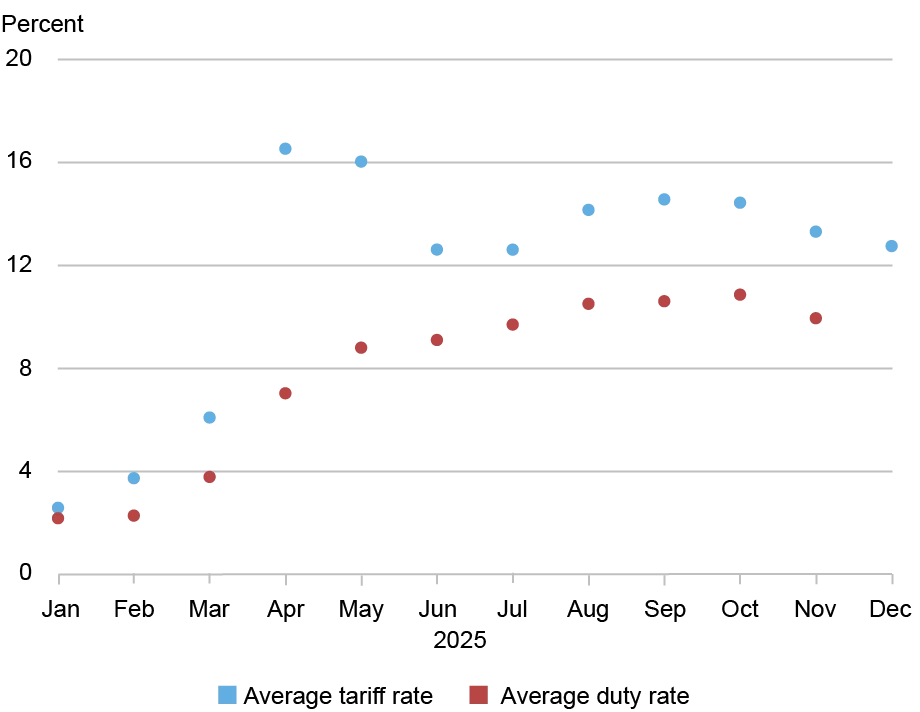
The drop in the average duty rate compared to the statutory average can be attributed to various exemptions in place. For instance, even with a 35% tariff on Canadian imports, the majority—around 83%—are exempt due to the U.S.-Mexico-Canada Agreement (USMCA). Additionally, the tendency of importers to pivot away from higher-tariff goods contributed to the observed disparity. Adoption of alternative suppliers was particularly evident during the tariff hikes on Chinese goods.

Shifts in Global Supply Chains
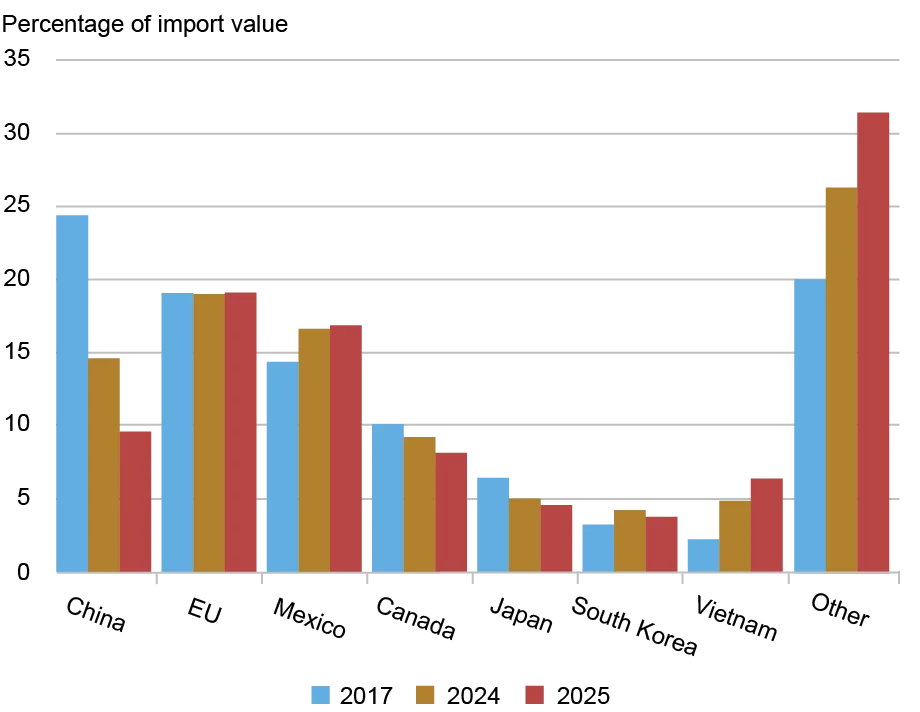
Shifts in import shares by country reveal critical changes in sourcing patterns. Between 2017 and 2025, imports from China saw a marked decline. Initially constituting about 25% of total U.S. imports in 2017, China's share dropped to approximately 15% by 2024, and fell further to below 10% in the first eleven months of 2025. This decline is mirrored by increases in market shares for Mexico and Vietnam, indicating a significant reorientation of supply chains in response to tariff pressures.

Understanding Tariff Incidence
The concept of tariff incidence explores how the financial burden of tariffs is shared between domestic importers and foreign exporters. While U.S. importers initially pay the duties, the actual economic burden may shift if exporters reduce their prices to maintain market competitiveness.

For example, if a foreign company sells a good for $100 and a 25% tariff is applied, the total cost for U.S. importers rises to $125. In a scenario where the exporter lowers prices to absorb some of the tariff costs—say, slashing the price to $80—the import price would stabilize at $100, shifting the financial responsibility to the exporter. This showcases a complex interaction where a higher tariff can simultaneously force price adjustments in international markets, altering who ultimately bears the cost.
Research from previous tariffs indicates that foreign exporters did not make significant cuts to their prices, resulting in full pass-through of tariffs onto U.S. import prices. This finding is corroborated by subsequent analyses for the 2025 tariffs, showing that the primary burden remained with U.S. firms and consumers throughout the tariff periods.

Analysis of Data on Tariff Incidence
Current assessments demonstrate disturbing trends for U.S. importers. Data analysis covering the period from January through November 2025 shows that U.S. importers absorbed a staggering 94% of the tariff costs in the initial months. Although there was some downward adjustment of foreign export prices, the impact was minimal—only a 0.6 percentage point reduction for a 10% tariff.
The end of 2025 exhibited a slight change in these dynamics, with higher rates of pass-through observed. In November, while pass-through rates remained high at 86%, the downturn in foreign export prices increased to 1.4% for the same tariff rate, indicating that more of the burden started shifting to foreign sellers by year-end.
| Average by 2025 Period | Tariff Incidence on Foreign Exporters (%) (1) |
Tariff Incidence on U.S. Importers (%) (2) |
| January-August | 6 | 94 |
| September-October | 8 | 92 |
| November | 14 | 86 |
These figures illustrate an ongoing trend where the vast majority of cost burdens from tariffs are handled by U.S. interests. By the end of 2025, an average tariff of 13% was seen to inflate U.S. import prices by approximately 11%, significantly affecting market behavior and supply chain decisions.
In summary, the data emphasizes that U.S. firms and consumers remain the primary payers of tariffs imposed in 2025, with implications that could affect market strategies and pricing structures in the near future.
As the economic discourse continues, it will be crucial for businesses and policymakers to monitor how these tariffs evolve and their overall impact on the economy.