Side A · Liner notes
Inflation Dynamics and the Slope of the Phillips Curve: Insights from New Data
Banking · Words by William Garcia · Released
A recent analysis reveals that the Phillips curve steepens with larger cost shocks, indicating a nonlinear relationship between inflation and price adjustments.

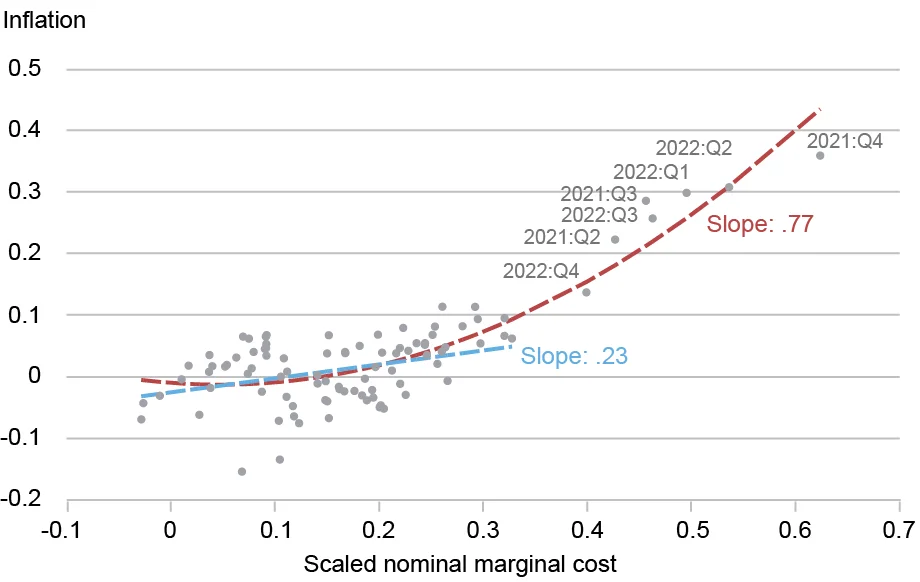
Inflation does not react uniformly to changes in costs. Recent observations highlight a distinctive shift in inflation dynamics, particularly during periods marked by significant economic shocks. In general, smaller shocks correlate with a one-to-one response in inflation—doubling the cost shock results in an equivalent rise in price levels. However, as recent global inflation trends demonstrate, this linear response can falter significantly when cost disturbances surpass certain thresholds.
Characterizing Nonlinear Inflation Dynamics
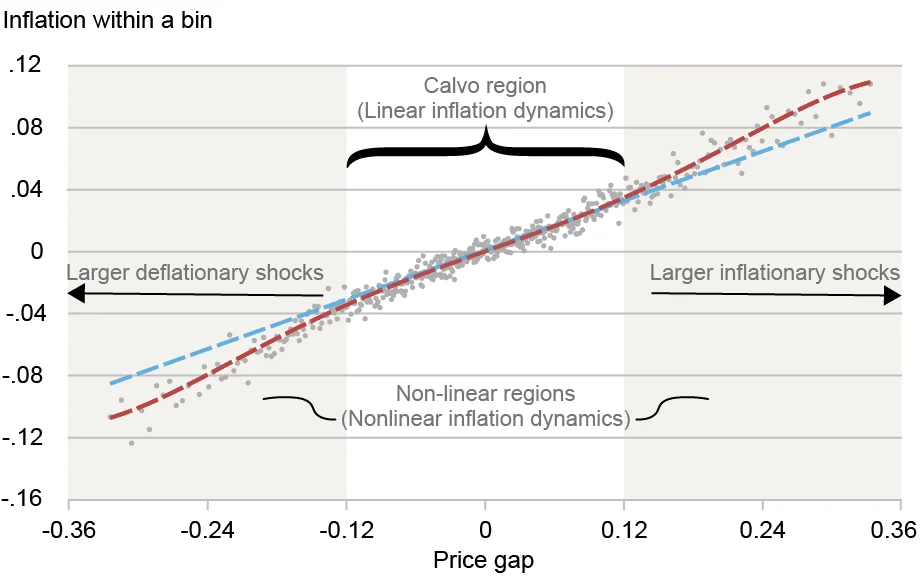
Recent research, particularly a working paper examining the Belgian manufacturing sector from 1999 to 2023, indicates that the relationship between changes in production costs and producer price inflation (PPI) follows a nonlinear trajectory during large economic disruptions. The analysis identifies a distinct threshold—around a 20% increase in annual costs—beyond which inflation sensitivity escalates sharply. In these high-stress situations, the increase in inflation can far exceed a simple doubling of the initial cost shock, mirroring the heightened inflationary pressures observed during the energy crises and supply chain snafus driven by the COVID-19 pandemic and geopolitical tensions.
State-Dependent Pricing Mechanisms
The observed nonlinear inflation dynamics stem from how firms adjust their pricing in response to varying cost shocks. In a simplified economic model where price changes occur randomly, not all firms facing significant cost increases will reprice simultaneously. Instead, only those experiencing unconventional deviations will enact changes in pricing. This notion introduces key insights from the Calvo pricing model, which suggests a uniform frequency of price changes regardless of economic conditions—a perspective that holds reasonably well during stable inflation periods.
Shifting Dynamics in Response to Shocks
In a broader context, pricing behavior diverges significantly during periods of substantial economic distress. Costly price adjustments—akin to what a restaurant faces when altering its menu—prompt firms to revise prices only when the need is imperative. This modification is evidenced by substantial increases in the frequency of price changes that emerged amid the pandemic's inflation, a behavior at odds with the assumptions laid out in the Calvo model.
Key Observations from the Data
Research involving administrative data from thousands of Belgian manufacturing firms sheds light on the dynamics of price adjustments. This analysis introduces three critical insights:
Fact 1: Greater Price Gaps Lead to Frequent Adjustments
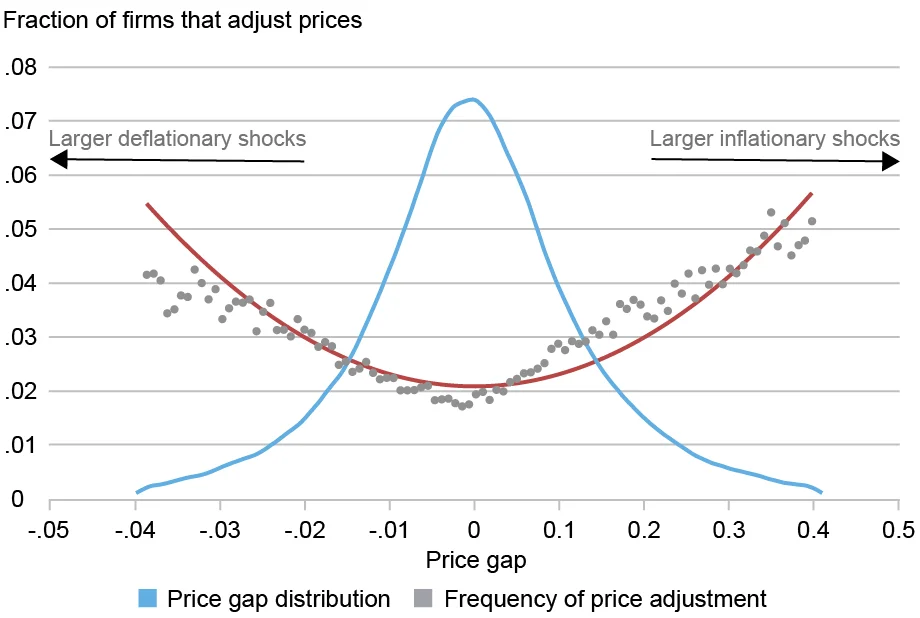
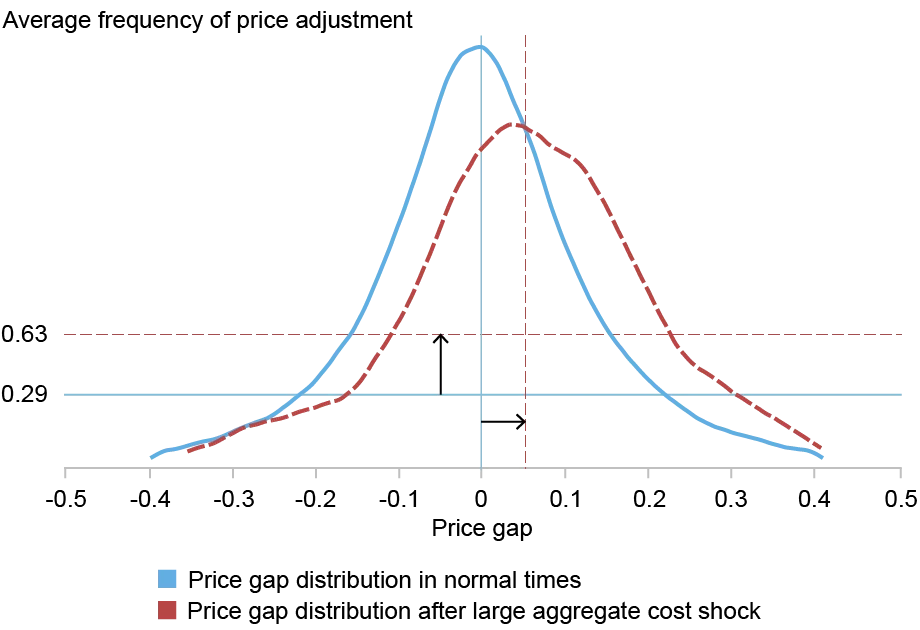
The relationship between the distance of a firm’s current price from its optimal price point and the frequency of its price adjustments is pronounced. The probability of re-pricing tends to rise when prices drift significantly—both above or below desired levels. This U-shaped relationship reveals a clear deviation from the linear assumption posited by the Calvo model.

Fact 2: Aggregate Shocks Alter Price Gap Distributions
Before the pandemic, the distribution of firms' price gaps typically centered around zero. However, during Q2 of 2022, influenced by spikes in energy costs and supply chain issues, this curve shifted rightward. As firms were compelled to adjust to escalated production costs, the share of those modifying their prices nearly doubled, driving an acceleration in inflation—consistent with predictions from state-dependent pricing models.

Fact 3: Nonlinear Growth of Inflation During Major Shocks
As firms experience varying levels of price gaps, the magnitude of inflationary response also varies. Analysis shows a steepening curve as shocks become larger, indicating disproportionate increases in inflation on the back of cost adjustments. At a certain level of price gap (approximately +/- 10%), adjustment frequencies stabilize, and inflation appears to increase linearly. However, in the tail regions, where shocks are amplified, the responsiveness can increase significantly, demonstrating the non-linear characteristics of inflation in times of distress.
Implications for Economic Decision-Making
Understanding how inflation reacts to different threshold shocks is crucial for policymakers and financial analysts. Recognizing the points at which the economy shifts from linear to nonlinear responses helps in forecasting inflation trends and making informed decisions.
The findings emphasize the need for adaptable strategies that consider changing economic conditions. Monitoring price gaps and adjustment frequencies provides valuable insights for navigating potential inflationary pressures as firms grapple with significant cost increases.
Simone Lenzu, author of this analysis and a financial research economist at the Federal Reserve Bank of New York, reinforces the need for continuous examination of these pricing dynamics to better anticipate shifts in inflation that can have widespread implications for the economy.
How to cite this post:
Simone Lenzu, “Does the Phillips Curve Steepen When Costs Surge?,” Federal Reserve Bank of New York Liberty Street Economics, February 5, 2026, https://doi.org/10.59576/lse.20260205