Side A · Liner notes
Analyzing the Term Structure of Risk Premia in the U.S. Corporate Bond Market
Banking · Words by Christopher Rodriguez · Released
This article examines the term structure of risk premia in the U.S. corporate bond market, revealing critical insights from yield analysis and duration characteristics.

Tomas Jankauskas explores the complexities of pricing short- and long-term assets, particularly in the context of the U.S. corporate bond market, valued approximately at $16 trillion by the end of 2024. Understanding the term structure of risk premia is essential for asset pricing models and can help explain various asset pricing anomalies observable in the market.

Extracting Risk Premia from Yields
Utilizing the forward-looking nature of corporate bond yields allows for the extraction of expected returns without relying on historical price performance. This is particularly beneficial as historical yield data can be skewed by atypical periods, such as the Global Financial Crisis or significant fluctuations in the risk-free rate. Essential to the calculations of risk premia is the expected default loss component.
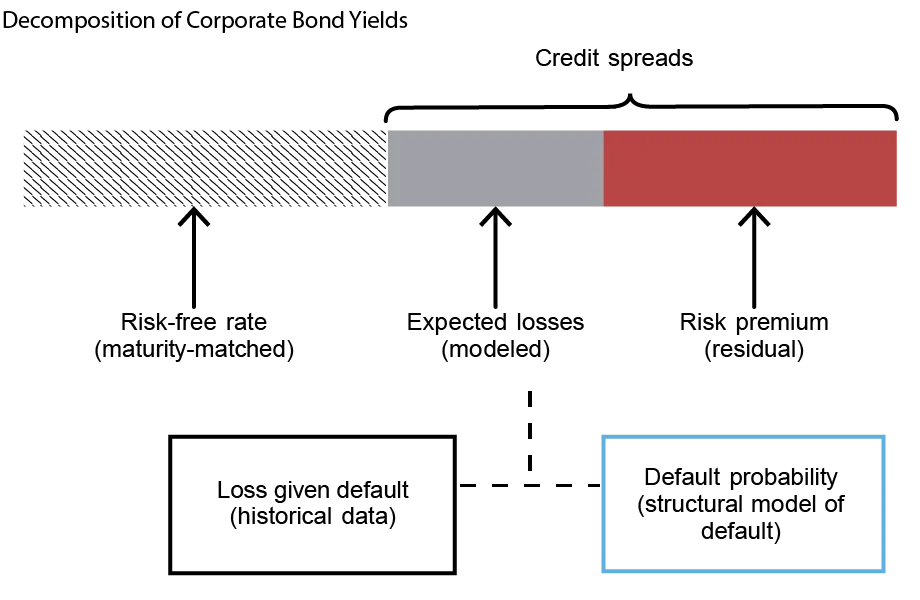
The yield on a corporate bond is comprised of three main elements: the maturity-matched risk-free rate, the expected default losses, and the risk premium. These components create credit spreads that can be directly observed. To estimate expected default losses, Jankauskas employs a structural model developed by Feldhütter and Schaefer (2018), which alongside historical loss data, offers a means of measuring risk premia across various maturities and firms. This method provides valuable insights into how investors assign value to differing risks.

Variation in Duration Across Corporate Bonds
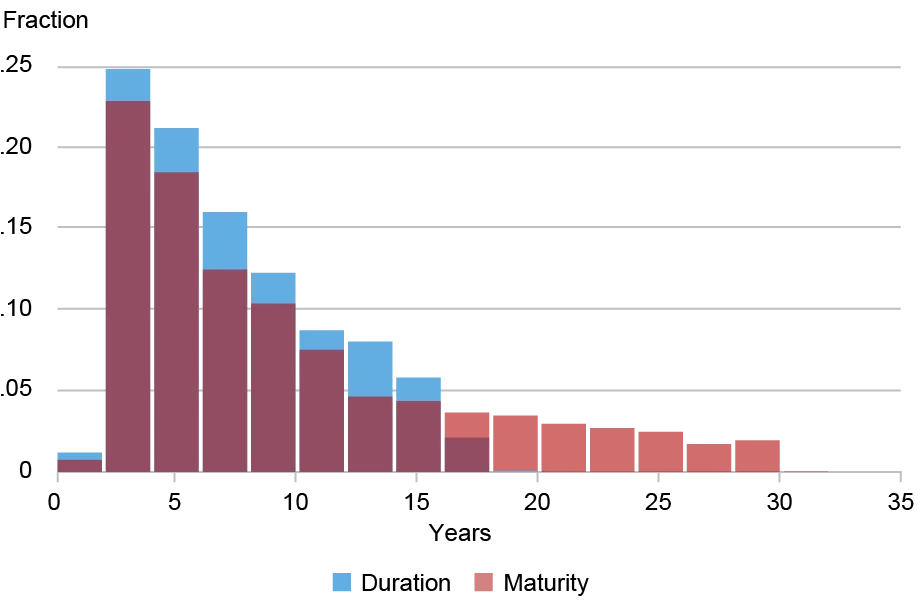
There's significant variability in the duration of corporate bonds, with durations ranging from a few years to over fifteen years. This divergence in duration facilitates the creation of diversified bond portfolios that can mitigate idiosyncratic risk while isolating the impact of duration on performance. Jankauskas forms these portfolios in June each year, maintaining a consistent composition for the duration of the year. The data reveals that the shortest-duration portfolios average a mere one to two years, while those in the longest duration decile average closer to fourteen years.
Distribution of Bond-Month Observations Across Maturity and Duration

| Low | 2 | 3 | 4 | 5 | 6 | 7 | 8 | 9 | High | High-Low |
|---|---|---|---|---|---|---|---|---|---|---|
| 1.3 | 2.4 | 3.4 | 4.2 | 5.1 | 6.0 | 7.1 | 8.8 | 11.5 | 14.1 | 12.7 |
The Slope of the Risk Premia Term Structure
Analyzing yields reveals an upward-sloping term structure, where the majority of this slope is concentrated between portfolios 1 and 5. This positive slope is primarily influenced by the increased risk-free rate. The decomposition analysis shows that the credit spreads follow a hump-shaped pattern, with the primary conclusion being that the risk premium term structure is also upward sloping.
Further investigations reveal that the average term premium amounts to approximately 3.4 percent, significantly influenced by an average risk-free rate slope of 2.1 percent, coupled with a risk premium slope of 1.3 percent. This positive risk premium contributes meaningfully to long-term bond yields, accounting for roughly 20 percent of those yields and 30 percent of total expected returns. This positive slope aligns with established theories connecting risk exposure to asset maturity.

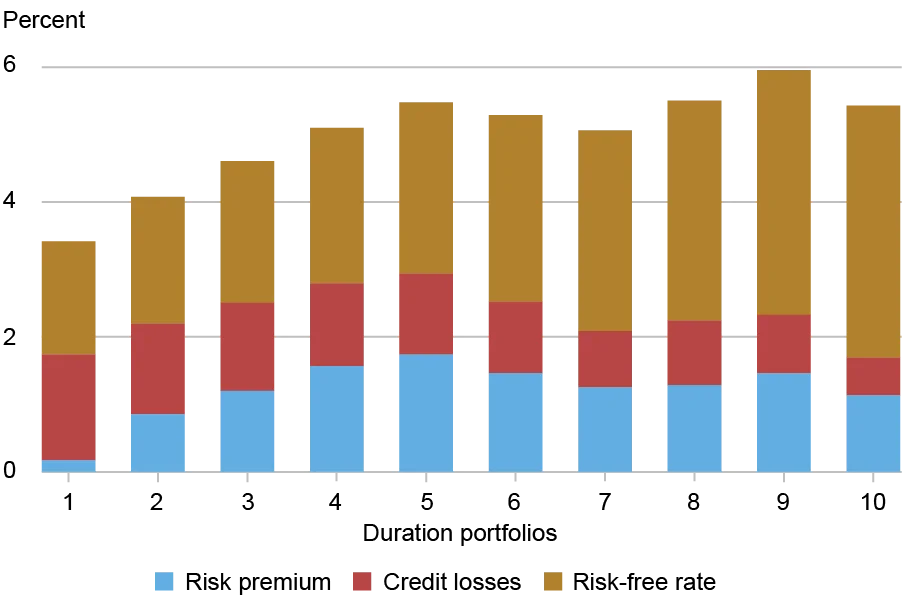
The magnitude of the risk premia appears economically reasonable. Short-term bonds, typically with durations of one to two years, show a near-zero premium. This minimal premium suggests that investors do not differentiate significantly between corporate and short-term government bonds. However, at longer durations, the risk premium increases considerably, peaking at approximately 1.8 percent for bonds with four to six years of duration and tapering to about 1.5 percent for the longest maturities. This phenomenon is largely attributable to the predominance of highly rated issuers in the long-term bond market.
While the risk premia may seem modest, especially in comparison to equity estimates that range from 10 to 20 percent, this discrepancy can be explained. These bond returns are calculated net of the maturity-matched risk-free rate, and the equity risk premium inherently compensates for potential upward volatility, an aspect to which bonds are less exposed.
Conclusion
This analysis quantifies the forward-looking term structure in the U.S. corporate bond market. Evidence suggests that while risk premia may not be large in absolute terms, they play a critical role in determining the term structure of corporate bond returns. The substantial upward slopes of both the risk-free rate and the risk premium create a substantial term premium, indicating a meaningful presence of risk premia in the capital markets. The findings underscore the corporate bond market’s utility in enhancing understanding of asset pricing mechanisms and portfolio strategies.

Tomas Jankauskas serves as a financial research economist within the Research and Statistics Group at the Federal Reserve Bank of New York.