Side A · Liner notes
NY Fed DSGE Model Update: Economic Growth and Inflation Projections for 2026
Banking · Words by Michael Rodriguez · Released
The March 2026 DSGE model update from the New York Fed predicts stronger economic growth and persistent inflation, influenced by increased investment and cost pressures.

This article outlines the latest economic forecasts produced by the Federal Reserve Bank of New York’s dynamic stochastic general equilibrium (DSGE) model, with significant updates since the December 2025 iteration. The forecast for 2026 anticipates stronger growth and more persistent inflation driven largely by heightened investment activity and various cost-push shocks.

Growth Projections
The model estimates a GDP growth of 1.0% for 2026, a revision upwards from the previous forecast of 0.6%. This adjustment reflects the economy's surprising resilience and higher-than-expected investment levels, particularly in sectors influenced by technological advancements. Notably, the GDP growth rate for Q3 2025 was revised to be about 1.5 percentage points higher than earlier predictions. This positive trend is largely attributed to marginal efficiency of investment (MEI) shocks, which have been identified as crucial drivers for a surge in AI-related investments late in 2025 and into early 2026. In sectors where AI integration has occurred, companies have reported significant productivity boosts, though this is variable across industries.
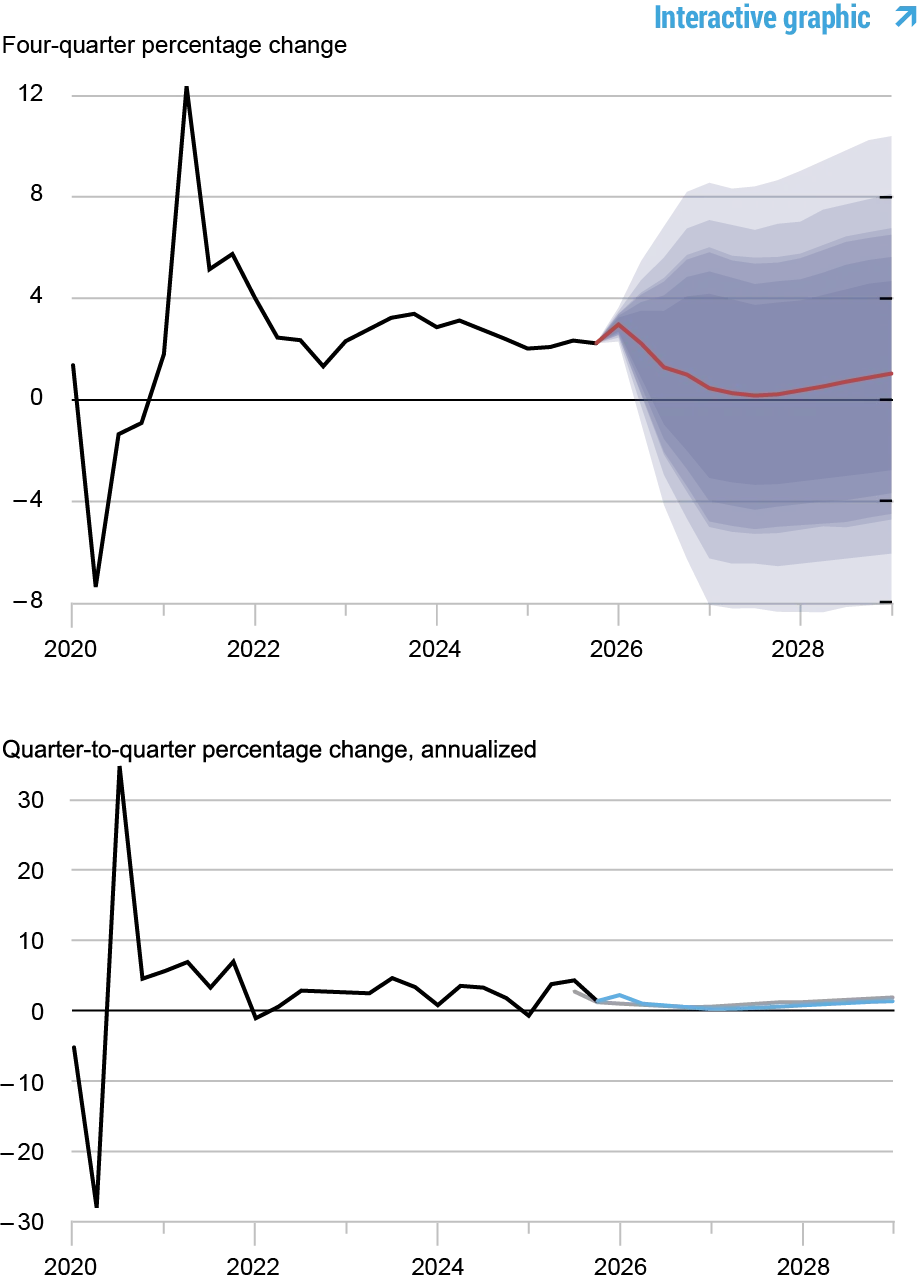
Projections for subsequent years (2027 through 2029) indicate a reduction in growth rates compared to earlier forecasts, with figures now at 0.2%, 0.9%, and 1.3% respectively, down from previous estimates. This reflects the anticipated fading effects of initial investment shocks; after an initial surge in growth, economies often settle back into a more normalized growth trajectory. When examining these numbers, it’s essential to consider how cyclical economic patterns tend to unfold, especially when driven by bursts of investment.
Moreover, the probability of a recession—defined as four consecutive quarters of negative growth—is assessed at 35.8%, which is a decrease from December’s 37.5%. While this reduction in recession probability signals some optimism, challenges remain, particularly with cost pressures still influencing inflation. Underlying factors such as global supply chain disruptions or shifts in consumer behavior could easily alter this outlook. Just look at the last few years of economic forecasts: they consistently grappled with unexpected downturns. It's about time cautious optimism rules the day.
Inflation Dynamics
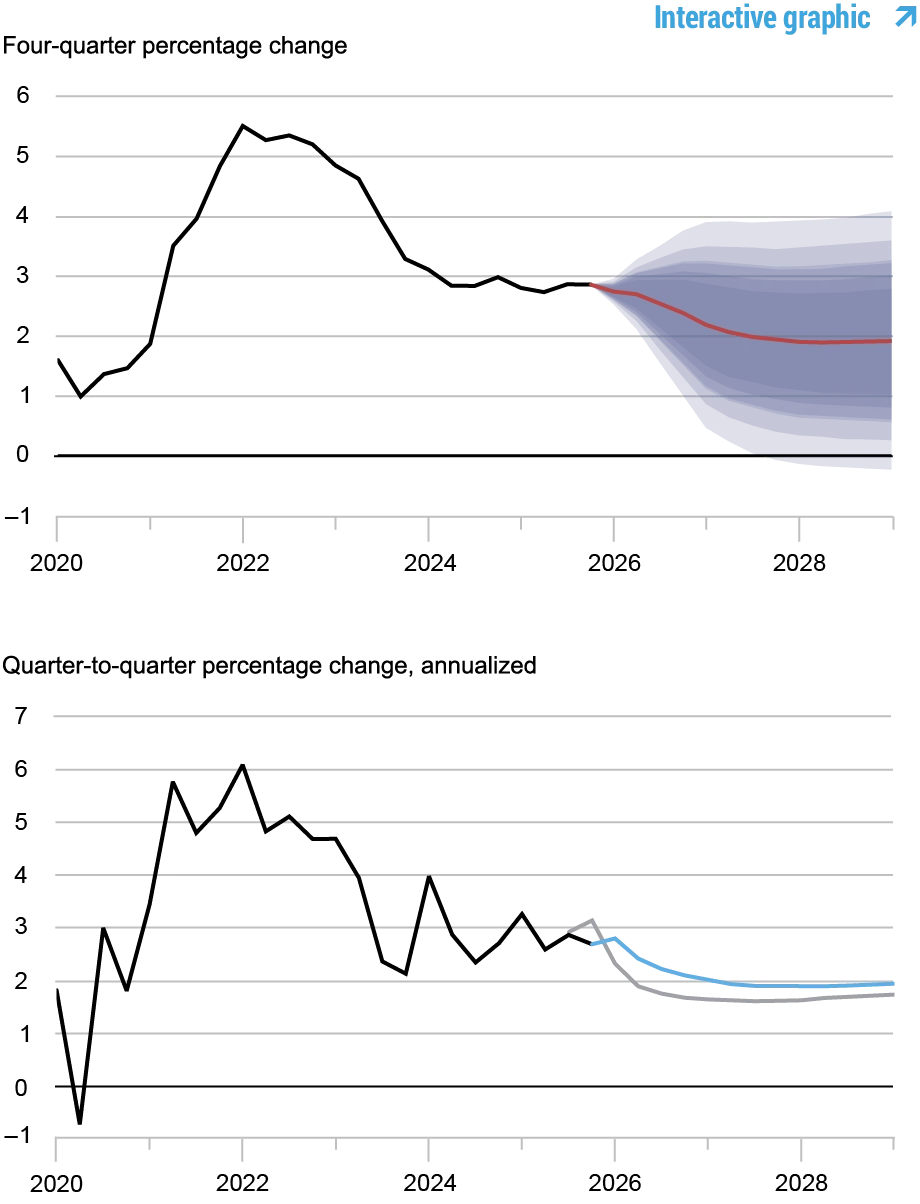
Core PCE inflation for Q4 2025 slightly underperformed expectations; however, the model anticipates Q1 2026 inflation to be approximately half a percentage point higher than the December forecasts. These deviations are attributed primarily to cost-push shocks, which may encompass the ramifications of tariffs and other specific factors impacting inflation, like energy prices. Such price pressures reflect ongoing global economic dynamics that can affect domestic consumers unexpectedly. These alterations in inflation forecasting demonstrate just how sensitive the economy is to external factors.

The updated inflation projections now estimate core PCE inflation at 2.4% for 2026, up from 1.9% previously. The adjusted rates for 2027, 2028, and 2029 are also revised upwards to 1.9%, 2.0%, and 2.0% respectively, contrasting with earlier figures of 1.6%, 1.7%, and 1.8%. These altered figures reflect an acknowledgment that inflation is proving to be more sticky than previously assumed; persistent inflation in sectors tied to labor costs or material inputs can often take significant time to moderate.

Natural Rate of Interest
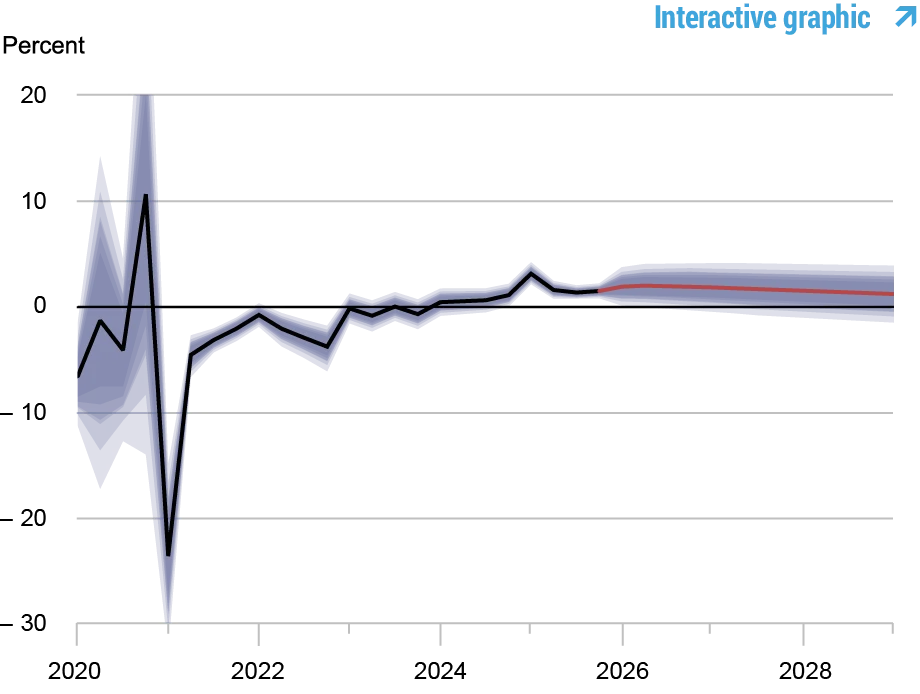
Predictions regarding the short-run real natural rate of interest (r*) have remained stable, with forecasts unchanged from December at 1.9% for 2026, followed by a gradual decline to 1.1% in 2029. The nominal federal funds rate (FFR) path has also not seen significant changes. This steadfastness indicates that the Fed's approach remains focused on stabilizing growth while addressing inflation concerns. However, with higher inflation expectations now taken into account, the model concludes that the current monetary policy stance might be more accommodative than previously perceived.

Such predictions suggest that the Fed may be adjusting its approach to accommodate a persistently higher inflation environment, raising questions about its implications for future monetary policy decisions. If you’re working in this space, staying abreast of these shifts is vital, as they could dictate investment strategies and influencing borrowing costs. The interplay between inflation and interest rates is often complex, driving reactions that can take years to unfold.

Comparative Forecasts
To better illustrate the changes in economic expectations, the following table contrasts the updated forecasts against their December counterparts:

| Forecast Period | 2026 | 2027 | 2028 | 2029 | ||||
|---|---|---|---|---|---|---|---|---|
| Date of Forecast | Mar 26 | Dec 25 | Mar 26 | Dec 25 | Mar 26 | Dec 25 | Mar 26 | Dec 25 |
| GDP Growth (Q4/Q4) |
1.0 (-3.4, 5.5) |
0.6 (-4.6, 5.9) |
0.2 (-5.0, 5.4) |
0.8 (-4.5, 6.0) |
0.9 (-4.7, 6.4) |
1.3 (-4.3, 6.8) |
1.3 (-4.3, 7.0) |
1.8 (-3.9, 7.6) |
| Core PCE Inflation (Q4/Q4) |
2.4 (1.6, 3.2) |
1.9 (0.8, 3.0) |
1.9 (0.8, 3.1) |
1.6 (0.4, 2.8) |
1.9 (0.6, 3.2) |
1.7 (0.4, 3.0) |
2.0 (0.6, 3.3) |
1.8 (0.4, 3.2) |
| Real Natural Rate of Interest (Q4) |
1.9 (0.6, 3.3) |
2.0 (0.6, 3.4) |
1.6 (0.0, 3.1) |
1.6 (0.0, 3.1) |
1.3 (-0.4, 2.9) |
1.3 (-0.3, 2.9) |
1.1 (-0.6, 2.7) |
1.2 (-0.5, 2.9) |
Notes: This table lists the forecasts of output growth, core PCE inflation, and the real natural rate of interest from the March 2026 and December 2025 forecasts. The numbers outside parentheses are the mean forecasts, and the numbers in parentheses are the 68 percent bands.
Implications for Policy and Markets
The March 2026 DSGE model forecast reflects a more optimistic short-term view on economic growth but signals caution regarding inflationary pressures. Investors, policymakers, and stakeholders must remain vigilant as these projections could shift with ongoing economic developments, particularly those influenced by external shocks such as geopolitical events. Monitoring the persistence of inflation, adjustments in investment strategies, and the Fed's response will be critical in assessing the broader economic environment.

And here's the thing: the changes forecasted inform key decisions across the board. Whether in corporate boardrooms or government chambers, economic modeling plays a pivotal role in shaping strategic directions. Investors should keep an eye on any shifts in central bank policies, as well as sector-specific trends that could arise from technological disruptions. This is more significant than it looks—policy moves based on these forecasts could alter financial markets and impact everyday consumers.