Side A · Liner notes
Evaluating U.S. Treasury Market Liquidity Trends Post-April 2025
Markets · Words by Joseph Rodriguez · Released
Liquidity in the U.S. Treasury market showed significant fluctuations following the April 2025 tariff announcement, stabilizing over the following months.
The U.S. Treasury market has experienced notable liquidity changes over the past year, driven by various economic and political developments. An initial deterioration of liquidity occurred in April 2025 after a spike in volatility linked to higher tariffs, followed by a gradual recovery that continued through February 2026. As the economic landscape evolved, it became clear that monitoring these liquidity trends remains crucial for market participants and policymakers alike.
Importance of Treasury Market Liquidity
As the largest securities market globally, the U.S. Treasury market boasts over $30 trillion in marketable debt. It serves multiple critical functions: financing government operations, implementing monetary policy by the Federal Reserve, and allowing financial institutions to manage interest rate risk and others' assets. Thus, understanding liquidity is vital, as it directly influences transaction efficiency and cost in these contexts.
Measuring Treasury Market Liquidity
Liquidity is defined as the swift conversion of an asset into cash at minimal cost. Following previous frameworks, three key measures are employed here: bid-ask spreads, order book depth, and price impact. These measures are derived from analyzing high-frequency data from the interdealer market for recently auctioned two-, five-, and ten-year notes during New York trading hours (7:30 a.m. to 5 p.m. Eastern time).
Price Volatility and Key Events
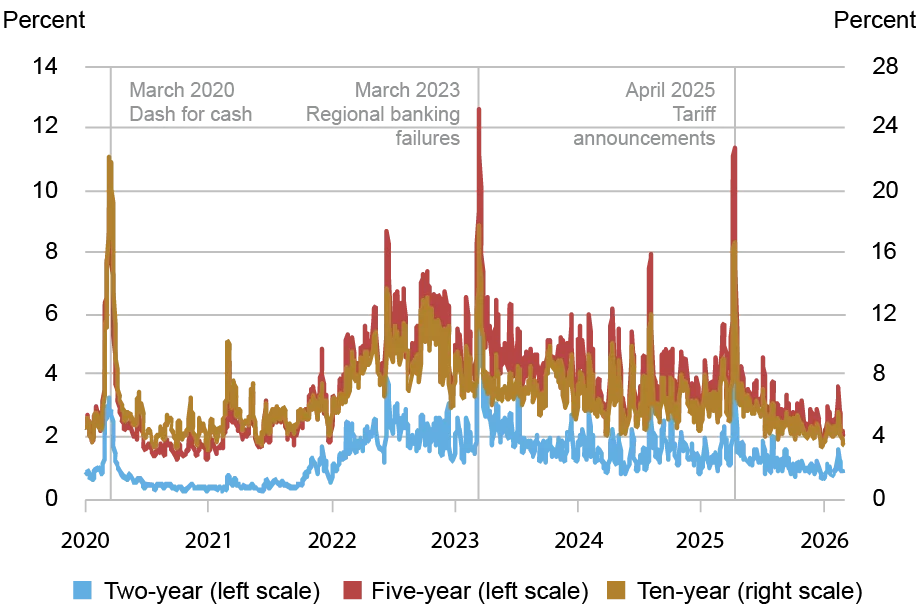
Price volatility is closely connected to liquidity conditions. An assessment of realized volatility, calculated daily for the same securities used in measuring liquidity, reveals its fluctuations around major events since April 2025. Following the April 2 announcement regarding the tariff increases, volatility rose sharply, peaking between April 7 and April 9. After this announcement, the 10-year yield fell from approximately 4.2% to about 3.9% before fluctuating back to around 4.0% the same day.
As trading progressed into the following week, yields rebounded sharply, indicating market anxiety. The 10-year yield climbed back to 4.5%—a 60-basis-point increase—between April 6 and April 8. This rise hints at underlying trading dynamics, including the unwinding of various swap trades, while foreign investors were reportedly less willing to hold U.S. Treasuries. An announcement by President Trump on April 9 postponing most new tariffs led to a notable decline in the 10-year yield, ending the week with an increase of 20 basis points from its April 2 status.
After the volatility spike in early April, conditions normalized. Subsequent events, including the implementation of the reciprocal tariffs and a Supreme Court ruling against the emergency tariffs, did not significantly elevate volatility. While there was a minor uptick in February 2026 linked to the release of the employment and consumer price reports, sentiment remained relatively stable through the end of February.

Liquidity Conditions Over the Past Year
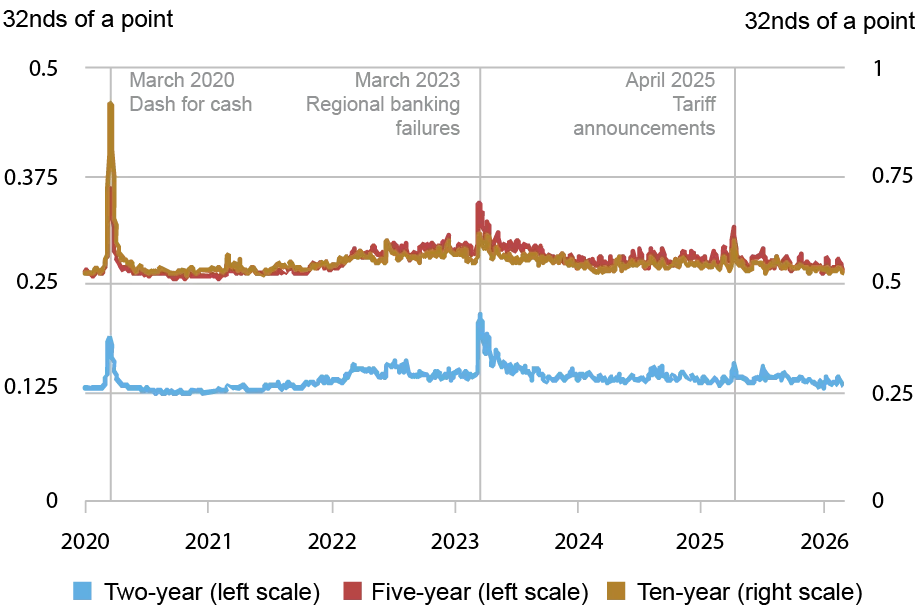
The bid-ask spread—the variability between the lowest selling price and the highest buying price—serves as a liquidity indicator. In April 2025, these spreads widened significantly following the tariff announcement, although not to the extremes of March 2020 or even the March 2023 regional banking crisis. They subsequently narrowed again after the April 9 announcement about tariff postponements, stabilizing around levels typically seen in recent years.

Figures illustrate the bid-ask spreads throughout this period, demonstrating a clear widening during the peak liquidity crisis but ultimately falling back to more normal levels.
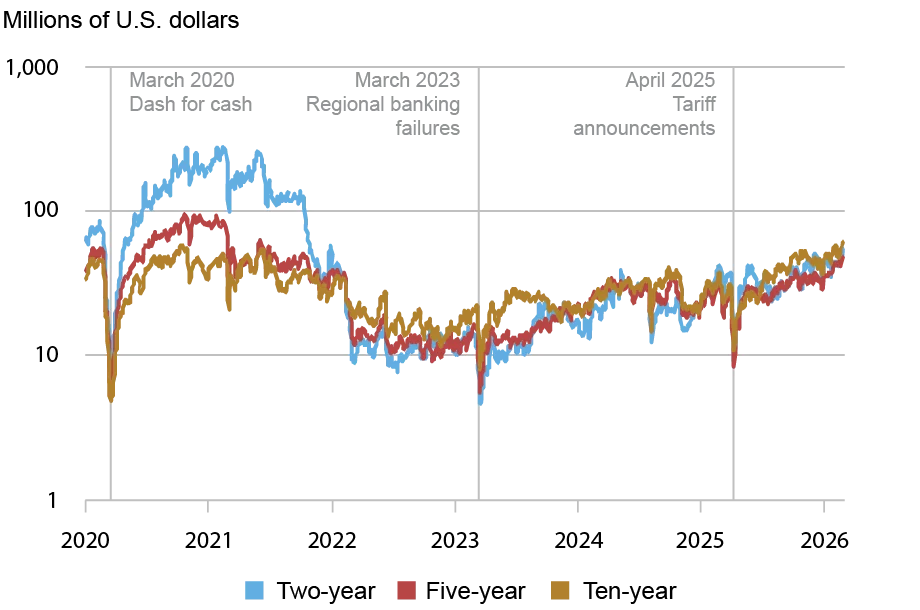
Order book depth, representing the quantity of securities available for purchase or sale at the best bid and offer prices, also exhibited substantial variation. A decline was witnessed in April 2025, bringing it down to its lowest since March 2023. This metric rebounded quickly, and by late summer 2025, order book depth was reported to be robust, reflecting positive liquidity conditions.
Charts depicting order book depth indicate a gradual increase following the initial lows in April 2025, suggesting enhanced market stability.

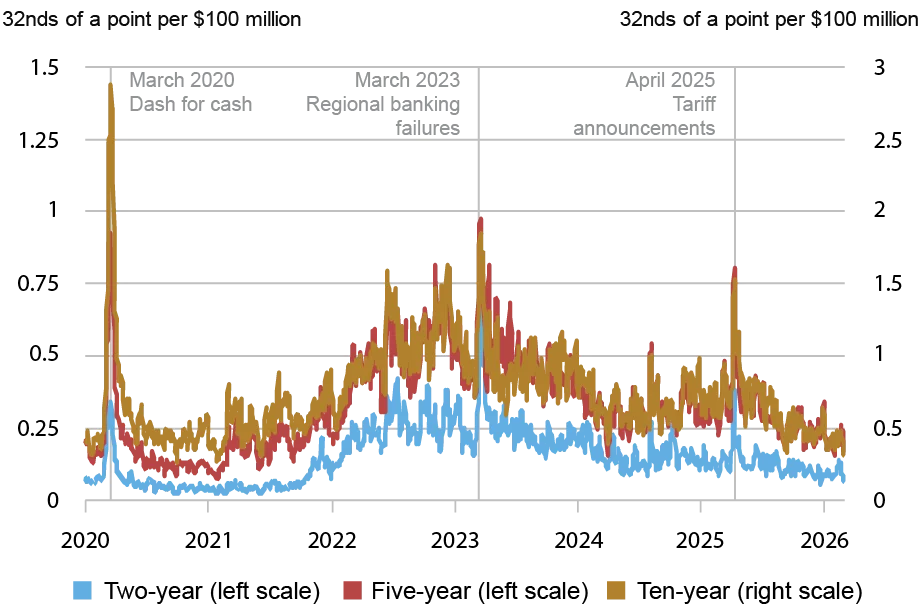
Additionally, the price impact of trades—essentially the price movement resulting from trading—rose sharply at the beginning of April but also reverted quickly afterward. The measures suggest that price impacts returned to levels comparable to 2021, signaling a healthy market adjusting effectively post-volatility.
Visualizations of price impact metrics further solidify this narrative, showing a quick recovery trajectory following the initial turbulence of April 2025.
Concluding Insights
The trends observed in Treasury market liquidity since April 2025 illustrate a volatile yet eventually stabilizing environment. The market responded swiftly to the April tariff announcement with a severe but short-lived liquidity dip. Following the easing of tariff pressures, conditions improved steadily, and by early 2026, liquidity reached levels unseen since 2021. Given recent geopolitical developments and the ongoing volatility surrounding interest rates, continuous monitoring of the Treasury market's liquidity dynamics is warranted.
Understanding these trends not only assists market participants in navigating current conditions but also provides insight for future economic forecasting and policy-making initiatives.