Side A · Liner notes
Examining the Fed's Monetary Tools and Their Impact on Money Market Dynamics
Markets · Words by Adam Copeland and Owen Engbretson · Released
The Fed's monetary tightening cycle utilized changes in rates and balance sheet size, affecting liquidity premiums and money market conditions significantly.
The Federal Reserve's recent tightening cycle has relied on two primary tools: modifying administrative interest rates and adjusting its balance sheet size. A recent Staff Report by Adam Copeland and Owen Engbretson delves into how these mechanisms influence money market conditions, specifically through the lens of Treasury repurchase agreements (repos). Their findings underscore the Fed's capability to shape financing conditions alongside broader economic influences.
Understanding the Repo Market
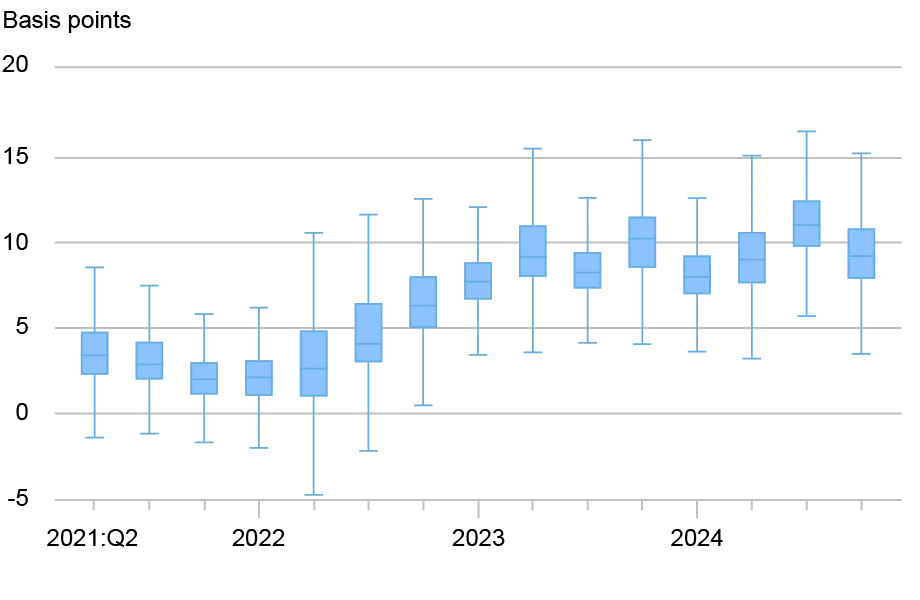
Repos are pivotal in financial markets, ensuring funding and liquidity. By early 2024, the U.S. repo market had roughly $5 trillion outstanding, highlighting its significance. The repo transactions, particularly those involving Treasury securities, are classified as secured funding trades. The Office of Financial Research (OFR) collects data that captures the majority of interdealer repo trading and a portion of dealer-to-client repos, providing a comprehensive view of market conditions.
Dealers function as the primary intermediaries, borrowing from cash-rich investors like money market mutual funds and lending to leveraged clients, including hedge funds. The OFR's data enables the analysis of spreads dealers charge when they intermediate funds—specifically, the difference between the rates at which they lend to clients versus those they pay to borrow from money market funds.
Impact of Monetary Policy Changes on Funding Costs
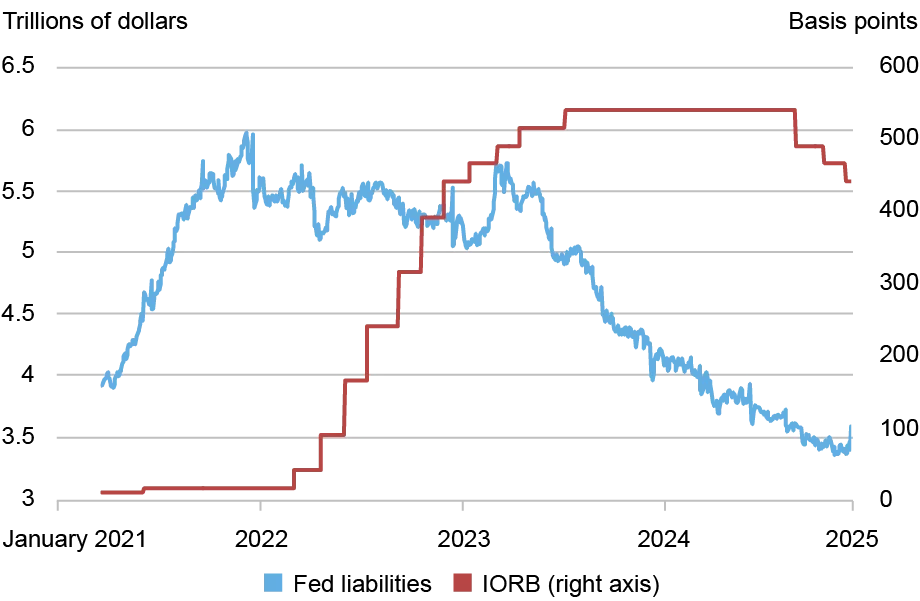
The analysis conducted reveals a direct relationship between monetary policy tools and the costs faced by dealers in securing funding. Both changes in the interest on reserve balances (IORB) and the Federal Reserve's liabilities substantially influence the liquidity risk premium—an essential consideration for intermediaries. As dealers aim to mitigate risks, they often maintain buffers of liquid securities, which incur costs reflected in their spreads.
By examining the data over the tightening period from March 2022, it's evident that as the Fed increased IORB from 15 to 540 basis points, the spreads widened due to increased liquidity risk premiums. Notably, this trend is reflected in the statistical analysis which reveals that a rise in IORB tends to elevate the liquidity risk premium significantly. For instance, a one standard deviation increase in IORB correlates to an increase in the premium by approximately 2.1 to 3.5 basis points. Conversely, a decrease in Fed liabilities tends to ease the premium by about 1.6 to 2.5 basis points.
Quantifying the Effects of Monetary Tools
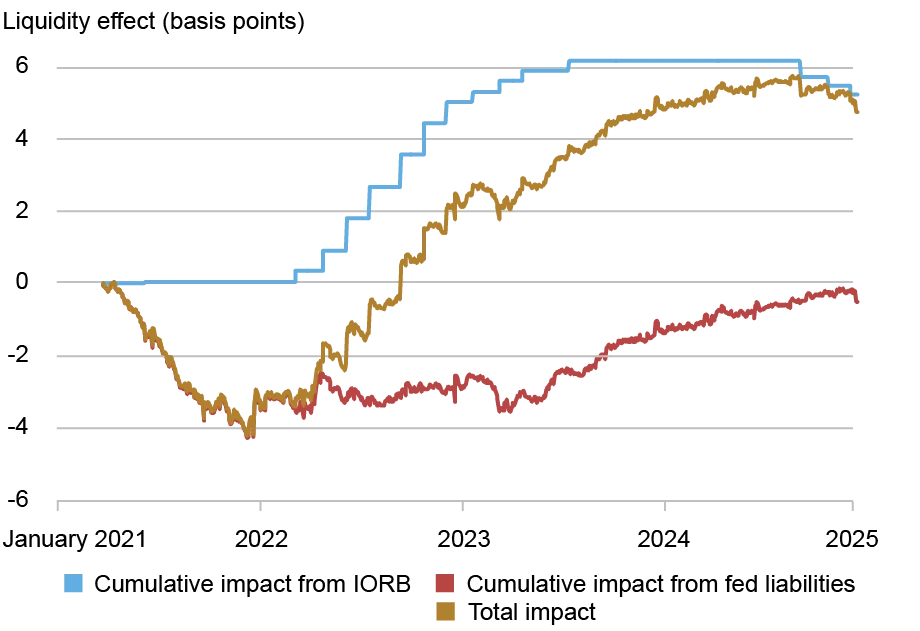
The analysis further illustrates the cumulative effects of the Fed's monetary policy on the liquidity risk premium. While the tools have distinct impacts, their effects can compound or offset depending on their implementation. For example, a large increase in Fed liabilities could yield a more pronounced effect on liquidity risk when IORB is low compared to when it is high due to the nonlinear nature of these relationships.
The observed patterns during the tightening phase depict that the Fed's strategy of increasing IORB while decreasing liabilities notably raised the opportunity cost of holding money, amplifying the liquidity risk premium. For instance, at the end of the analysis period, the cumulative impact suggested that a hypothetical decrease of 100 basis points in IORB accompanied by a $400 billion reduction in Fed liabilities could lead to a net neutral effect on the liquidity risk premium.

Broader Implications and Future Considerations
As seen from this tightening cycle, the Fed has significant levers to pull in managing both economic and financing conditions. With this dual approach, the central bank can address the liquidity strains in the money market while also adjusting economic support mechanisms. A potential scenario could see the Fed lowering rates to stimulate the economy while simultaneously reducing its balance sheet to mitigate excessive financial sector leverage—allowing the institution to balance economic growth with financial stability risk.
The results from this analysis open avenues for further inquiry into the interplay between monetary policy tools and liquidity conditions in markets. Understanding this relationship is paramount, as it not only aids in the management of current economic conditions but also informs policy decisions in times of financial distress.

In summary, the Fed's use of IORB changes and the management of Fed liabilities during the recent tightening cycle have indeed influenced the liquidity landscape in the repo market. These insights provide a framework for assessing future monetary policy actions and their potential ramifications on both the financing market and the broader economy.
Authors:
Adam Copeland is a financial research advisor at the Federal Reserve Bank of New York. Owen Engbretson serves as a research analyst at the same bank.
How to cite this post:
Adam Copeland and Owen Engbretson, “The Fed Has Two Tools to Influence Money Market Conditions,” Federal Reserve Bank of New York Liberty Street Economics, April 6, 2026, https://doi.org/10.59576/lse.20260406
Disclaimer: The views expressed in this post are those of the authors and do not necessarily reflect the position of the Federal Reserve Bank of New York or the Federal Reserve System. Any errors or omissions are the responsibility of the authors.