Side A · Liner notes
The Shifting Dynamics of U.S. Investment Income: Analyzing the Dwindling Surplus
Banking · Words by Joseph Miller · Released
The U.S. investment income surplus is diminishing due to rising interest rates and increasing foreign asset sales, marking a significant financial shift.

Foreign possession of U.S. financial assets has reached staggering heights, now estimated at a market value of $69 trillion, compared to U.S. holdings of foreign assets, which stand at $41 trillion. This disparity has been growing for decades; however, U.S. investment income receipts had traditionally surpassed payments until recent shifts in the financial landscape. Analysts Matthew Higgins and Thomas Klitgaard attribute the decline in the U.S. investment income surplus to the post-pandemic increase in interest rates and consistent net sales of U.S. assets to foreign investors.

The U.S. International Balance Sheet
The U.S. net international investment position can be illustrated using a balance sheet approach, wherein foreign assets owned by U.S. investors represent the asset side, while U.S. assets held by foreign investors comprise the liabilities. According to the U.S. Bureau of Economic Analysis, market values of these claims at the close of 2025 are as follows:
| Assets | Liabilities | Net Assets | |
| Total | 41.0 | 68.5 | -27.5 |
| Foreign direct investment | 13.9 | 20.3 | -6.4 |
| Portfolio equity shares | 15.1 | 22.3 | -7.2 |
| Interest-bearing assets | 10.8 | 25.9 | -15.1 |
| Fixed-income securities * | 4.1 | 15.9 | -11.8 |
| Other lending ** | 6.7 | 10.0 | -3.2 |
| Gold held as reserves | 1.1 | NA | 1.1 |
Notes: All figures are estimated market values. Total assets and liabilities exclude the gross notional value of derivative positions; these have a net value of roughly zero.
* Includes securities held as foreign exchange reserves.
** Largely bank loans, bank deposits, and trade credit.
Total U.S. foreign asset holdings amount to $41 trillion, with foreign direct investment (FDI) covering about one-third. Portfolio equity investments make up another third, while the remainder is in interest-bearing assets, including fixed-income securities and cross-border bank loans. Conversely, foreign assets within the U.S. nearly reach $69 trillion, with foreign direct investment also comprising about $20 trillion, over $22 trillion in U.S. stock market investments, and $26 trillion in interest-bearing claims.

The United States has a net international investment position of -$28 trillion, amounting to 90 percent of its gross domestic product (GDP). Every major asset category reflects a deficit when comparing U.S. assets to liabilities.
The Balance Sheet, Financial Flows, and Valuation Changes
Understanding the evolution of the U.S. net investment position is crucial as it directly links with the current account balance, the broadest indicator of trade. A deficit in U.S. exports relative to imports necessitates financing through domestic asset sales. Running a current account deficit while adding foreign assets requires increasing domestic sales.

Market price fluctuations also influence U.S. assets and liabilities. A rise in foreign stock prices effectively boosts the estimated values of U.S. equities and FDI holdings. In contrast, fluctuations in the dollar currency impact U.S. foreign liabilities minimally, as these are primarily dollar-denominated. Since the end of 2019, the net position has worsened, moving from -$12 trillion to -$28 trillion, a $16 trillion decline over two years.
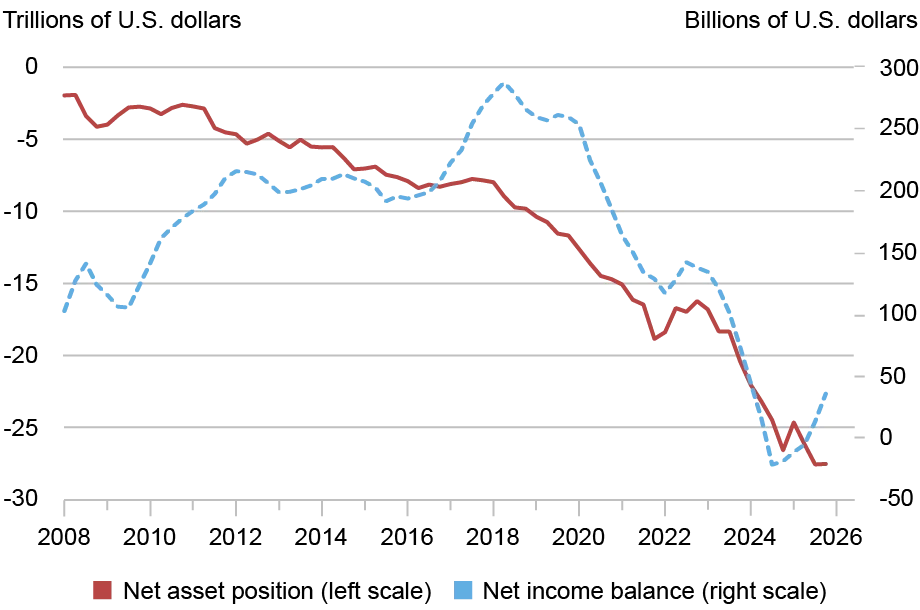
Notes: Net asset position is at market value. Net income is measured as a four-quarter rolling sum.
The worsening position can be attributed to various financial flows and valuation changes. Financial flows accounted for -$5.5 trillion of this decline, with a significant gap between U.S. purchases of foreign assets at nearly $6 trillion and foreign purchases of U.S. assets surpassing $11 trillion. Alongside these transactions, valuation shifts have negatively impacted the U.S. net position by $10 trillion since 2019 due to massive gains in liabilities primarily driven by surging foreign stock prices.

The Income Surplus Puzzle
Despite mounting net liabilities, the U.S. income balance has exhibited unexpected resilience. Though it has dipped from a surplus of $260 billion in 2019 to a near equilibrium in 2024 and 2025, this remains a significant discrepancy against the background of rising U.S. liabilities. The dynamics of net income flows reveal crucial insights into this trend.
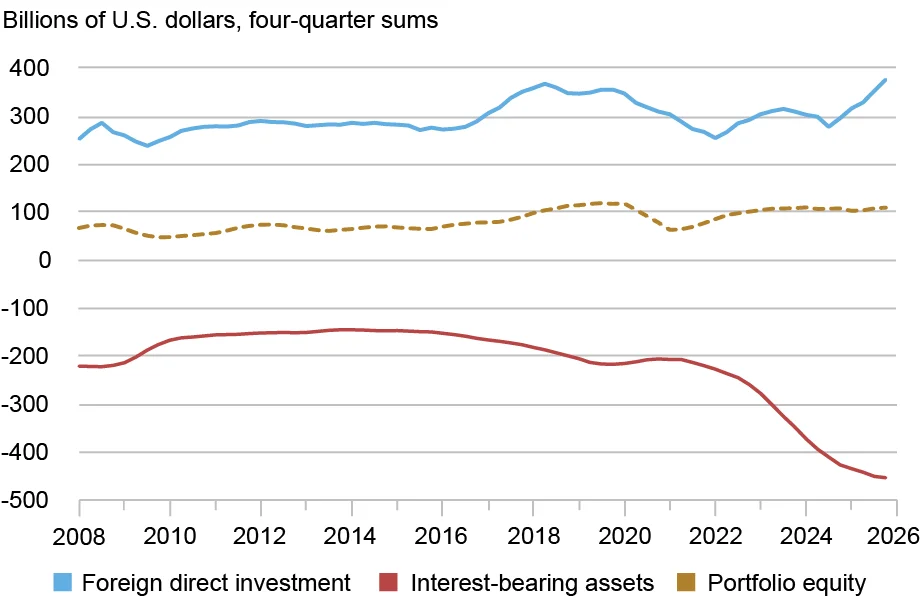
Note: Figures show four-quarter sums for income receipts less income payments.
U.S. FDI has generated a reliable net income surplus, which, despite pandemic-induced lows around $250 billion, rebounded to approximately $360 billion. The portfolio equity segment has also maintained a consistent surplus, remaining within a range of $70 billion to $120 billion since 2019. Such surpluses illustrate that U.S. assets yield higher returns than comparable liabilities.

However, the U.S. position in interest-bearing assets has been a source of substantial income deficits, particularly since the 2008 financial crisis. The interest balance has ballooned to reach a deficit of $450 billion last year, exerting downward pressure on the overall income surplus.
The U.S. Rate of Return Advantage
Evaluating rates of return on foreign assets highlights the disparity in income accrued from U.S. investments compared to liabilities. This analysis includes income sources such as dividends from FDI and portfolio equity, and interest receipts from interest-bearing assets.

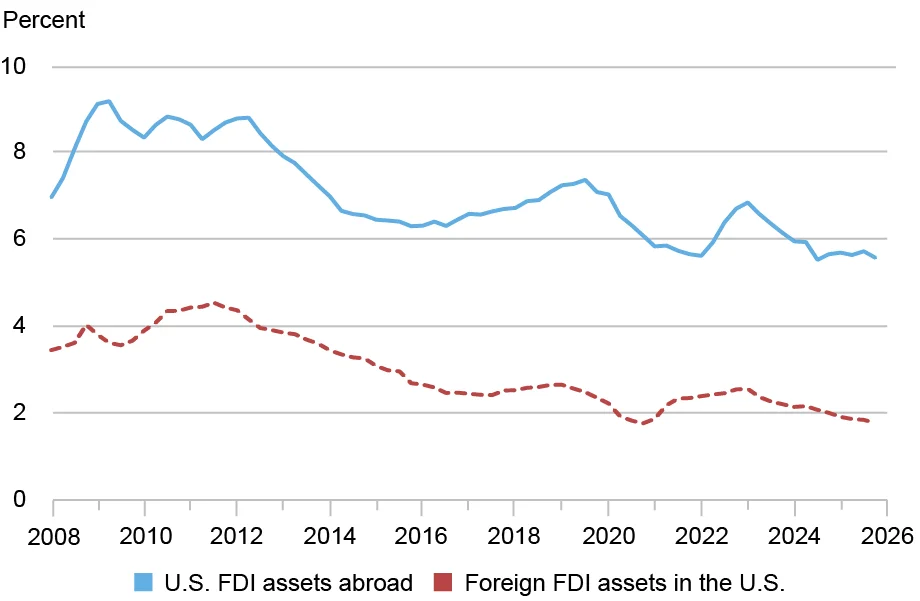
Note: Returns are measured as income-receipts or payments of the past four quarters divided by estimated market values.
The stark contrast in returns between U.S. investments abroad and domestic liabilities underscores the positive FDI income balance, despite a negative net asset position. For example, a recent profit rate of 5.6 percent on $14 trillion in assets significantly surpasses a 1.8 percent rate on $20 trillion in liabilities. This achievement in FDI profitability has been pivotal in maintaining a positive overall U.S. income balance.
Moreover, despite a less pronounced advantage, the U.S. shareholder returns on portfolio equity remain high enough to contribute positively to the aggregate income balance.
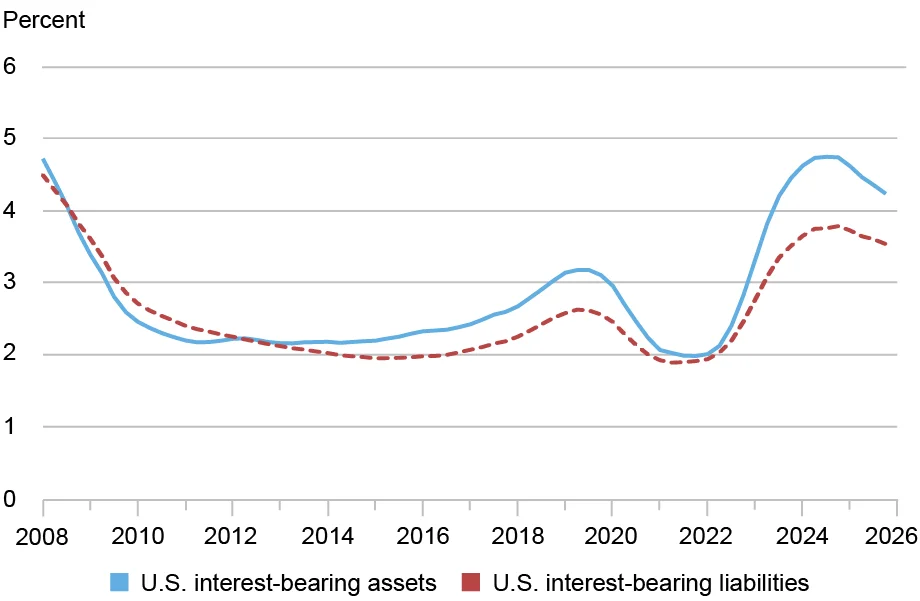
Note: Returns are measured as income-receipts or payments over the past four quarters divided by estimated market values.
Overall, the parallel movements of returns on interest-bearing assets and liabilities are notable, resulting from similar currency denominations and global economic shocks influencing central banks. The sharp increase in interest rates in 2022 and 2023 during the post-pandemic recovery highlighted the vulnerabilities of net income given the large U.S. liabilities in this sector. Calculations suggest that around $170 billion of the $240 billion rise in net payouts since 2021 correlates with higher interest rates. The reduction in market rates since 2024 has mitigated potential further increases in interest deficits.
Conclusion
The financial obligations tied to U.S. assets owned by foreign investors represent an increasing burden on the American economy. Payments including profits, interest, and dividends that could have benefitted U.S. investors instead flow overseas. The ongoing requirement to liquidate U.S. assets to offset trade deficits indicates that this financial strain will likely continue.
Moreover, as the U.S. net liability position in interest-bearing assets grows, the income balance becomes increasingly subject to interest rate fluctuations. The current valuation of -$15 trillion means that a 1 percentage point increase in interest rates could reduce U.S. net income by $150 billion, while a decrease would have a similar positive effect. Such sensitivities were notably less pronounced just five years ago, indicating that changes in the financial landscape have made the income balance more precarious.