Side A · Liner notes
New York Fed DSGE Model Insights: Inflation and Economic Growth Forecasts for 2026
Banking · Words by David Rodriguez · Released
The New York Fed's DSGE model revises inflation forecasts upward for 2026, reflecting higher core PCE inflation and moderated GDP growth expectations.

The latest update from the Federal Reserve Bank of New York on its dynamic stochastic general equilibrium (DSGE) model highlights significant shifts in economic forecasts since March 2026. Notably, the projections for inflation and the real natural rate of interest have seen marked changes, which could have widespread implications across various economic sectors and stakeholders.

Inflation Forecasts on the Rise
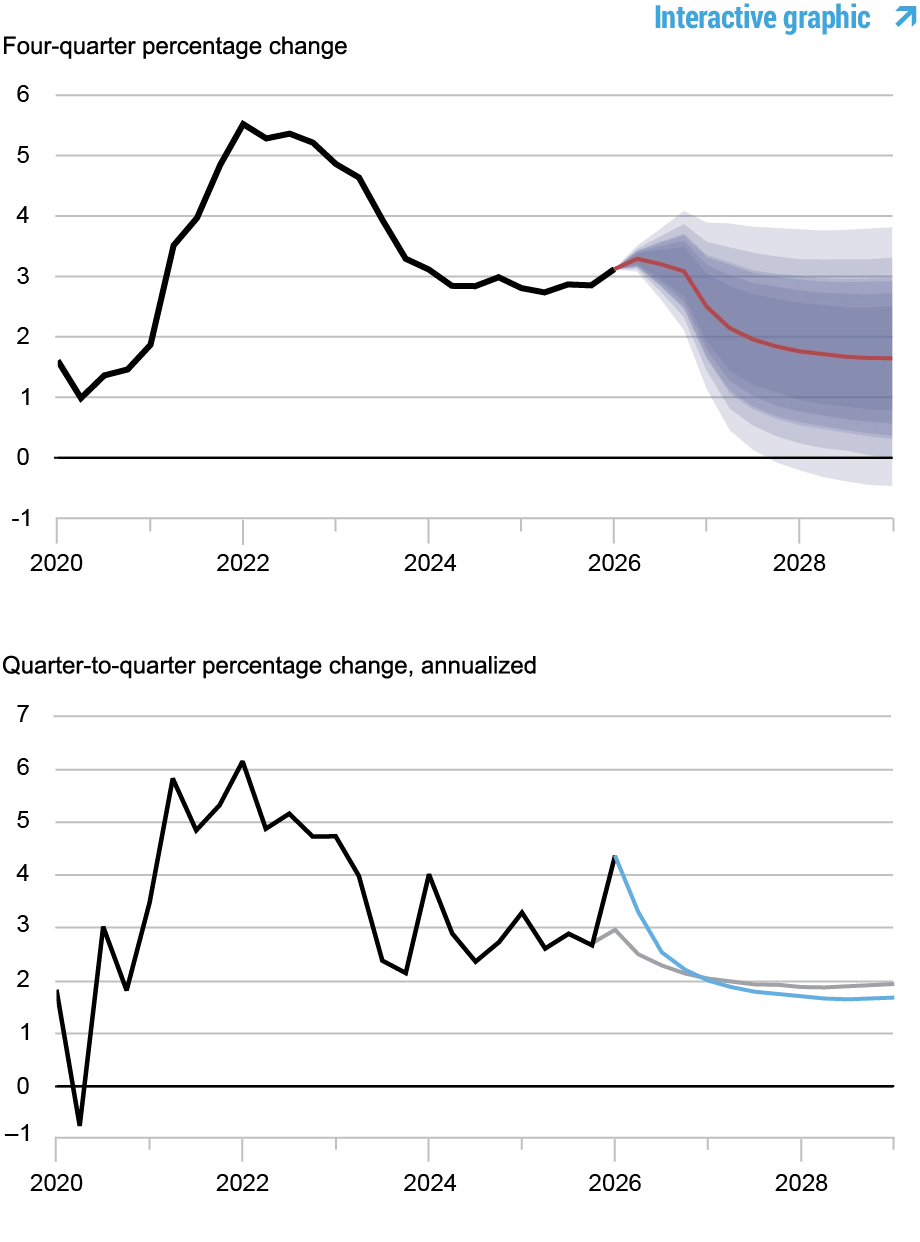
In its June 2026 forecast, the DSGE model indicates that core inflation is now projected at 3.1 percent for the fourth quarter of 2026, a substantial rise from the 2.4 percent predicted in March. This upward adjustment reflects new data and insights that have emerged in recent months. The model attributes this forecast miss primarily to mark-up shocks, which may encompass external factors such as tariffs and energy prices. Interestingly, the DSGE model expects these shocks to diminish by the end of 2026, suggesting that inflation rates might stabilize thereafter, as indicated by relatively flat inflation forecasts throughout the remaining years of the projection.
This rising inflation projection suggests broader economic pressures. Higher core inflation can significantly impact consumers' purchasing power and could lead to increased costs for businesses, which may attempt to pass these costs onto consumers. The Federal Reserve's vigilant stance on inflation also indicates its potential for interest rate hikes if inflation continues to exceed targets. For those in financial services, understanding these nuances can be vital; inflationary trends can destabilize markets, affecting everything from investment portfolios to lending rates.
Macro-Economic Outlook: GDP Growth Adjustments
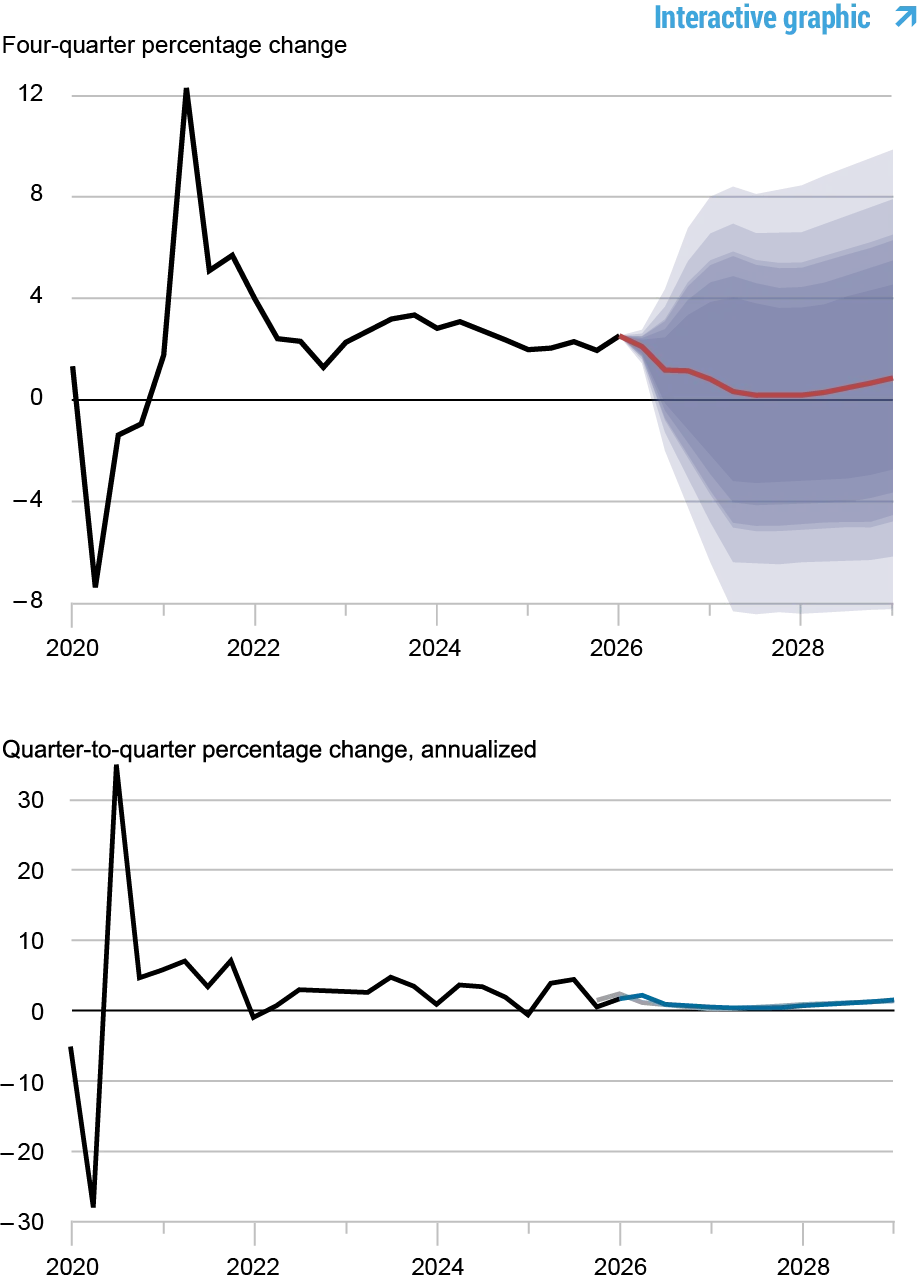
On the output front, the DSGE model has adjusted its growth predictions upward compared to its earlier forecasts, now indicating GDP growth of 1.2 percent for 2026, compared to 1.0 percent previously. However, these projections still reflect caution. The model sees some positive influence from the increasing investment spurred by advancements in artificial intelligence, which is significantly affecting the marginal efficiency of investment (MEI) and driving output higher in the immediate term. Nevertheless, adverse markup shocks are still expected to weigh down overall future growth potential.
It's significant that while we see a slight increase in GDP growth forecast, the revision barely nudges the economy from a lethargic pace. With an economy still grappling with uncertainties such as geopolitical tensions, supply chain challenges, and workforce shortages, the expected growth also seems to hinge largely on external technological advancements rather than a fundamental shift in economic fundamentals. If you're working in this space, understand that these market dynamics could change rapidly with further developments or shocks.

Short-Run Real Natural Rate of Interest Adjustments
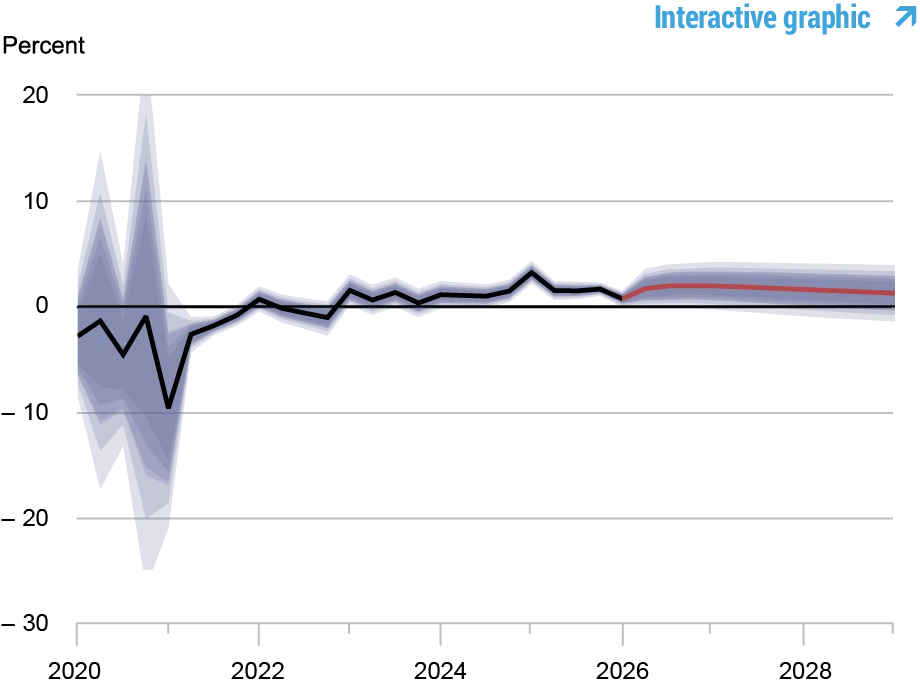
The forecast for the short-run real natural rate of interest (r*) has also seen a slight upward revision, now set at 2.0 percent for 2026, an increase from March's forecast of 1.9 percent. This adjustment indicates a slowly improving outlook, attributed in part to higher total factor productivity (TFP). In subsequent years, the projections remain modest at 1.7 percent for 2027 and 1.3 percent for 2028, reflecting a cautious approach that emphasizes potential long-term challenges.

Moreover, the trajectory of the natural rate has substantial implications for monetary policy decisions. A higher r* suggests less need for aggressive rate increases aimed at curbing inflation, which could lead to a more stable borrowing environment for consumers and businesses alike. This scenario is particularly inviting, but one must remain skeptical of how quickly such improvements can hold in a volatile economic backdrop.

Data Sources and Methodological Insights
The updated forecasts utilize a range of economic data available through the first quarter of 2026, supplemented with second-quarter estimates from the Philadelphia Fed’s Survey of Professional Forecasters (SPF). Notable data points included yields on 10-year Treasury bonds and Baa corporate bonds, which were averaged through May 27, 2026. It’s important to understand that these forecasts are not definitive; instead, they serve as inputs into the broader analytical framework employed by the New York Fed's research staff to gauge economic conditions.

These methodologies come with their own sets of limitations, especially since they depend on models that simplify complex real-world interactions. Past experiences suggest that reliance on model-driven forecasts can lead to substantial forecasting errors, mainly when unexpected shocks arise. There's an inherent need for stakeholders to combine these quantitative analyses with qualitative insights for a more rounded understanding of economic conditions.

Forecast Breakdown: Key Metrics
Below is a concise summary of key economic indicators as per the most recent DSGE forecasts:

| Forecast Period | 2026 | 2027 | 2028 | 2029 |
|---|---|---|---|---|
| GDP Growth (Q4/Q4) | 1.2% (-2.2%, 4.5%) | 1.0% (-3.4%, 5.6%) | 0.2% (-5.0%, 5.2%) | 0.2% (-5.1%, 5.4%) |
| Core PCE Inflation (Q4/Q4) | 3.1% (2.5%, 3.7%) | 2.5% (1.6%, 3.3%) | 1.8% (0.7%, 3.0%) | 2.0% (0.8%, 3.2%) |
| Real Natural Rate of Interest (Q4) | 2.0% (0.7%, 3.3%) | 1.9% (0.6%, 3.3%) | 1.7% (0.2%, 3.1%) | 1.6% (0.0%, 3.1%) |
These figures underscore the evolving economic picture and the inherent uncertainties facing policymakers and financial markets. Investors and financial professionals should pay close attention to these trends, as they have significant implications for market dynamics and risk management strategies. The variability you see in these numbers reflects a broader spectrum of potential economic scenarios that could emerge in the coming years.

Implications for Stakeholders
As inflation rises and growth forecasts adjust, various stakeholders—ranging from shareholders to policymakers and consumers—may need to rethink their strategies. The potential impacts on borrowing costs, investment decisions, and consumption trends necessitate a careful analysis of these evolving economic conditions. Understanding these forecasts and their underlying assumptions will be vital as stakeholders navigate the uncertainties of the economy.

This situation raises critical questions about how organizations should position themselves in an unpredictable environment. Are contingency plans in place to address possible market fluctuations? For businesses, how will increases in borrowing costs affect expansion plans? If you're managing a portfolio, reassessing asset allocation strategies could be necessary as these economic indicators shift. The implications are far-reaching, not just for immediate financial outcomes but for long-term planning as well.
For continued insights from the Federal Reserve Bank of New York's DSGE model, interested parties can refer to the accompanying charts and interactive tools available on the New York Fed's research webpage.