Side A · Liner notes
Emerging Market Economies' Resilience During the 2022-23 U.S. Monetary Tightening Cycle
Markets · Words by Shaghil Ahmed, Ozge Akinci, and Albert Queralto · Released
Emerging markets demonstrated greater resilience than predicted during the U.S. monetary tightening of 2022-23, with vulnerabilities impacting financial and growth outcomes differently.

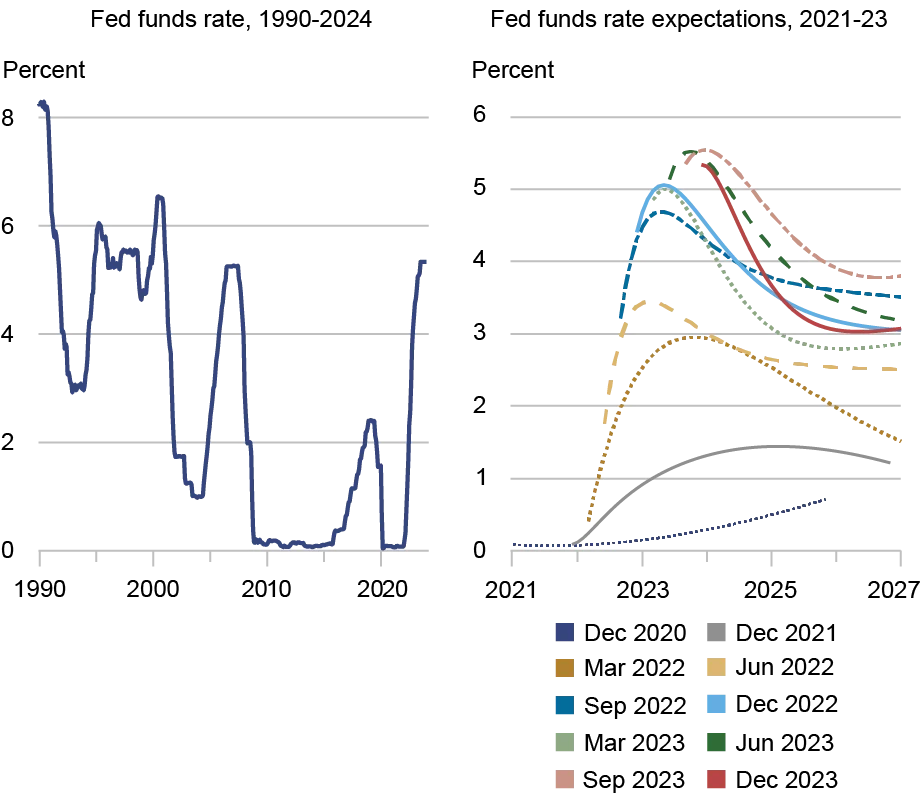
In the context of global finance, the spillover effects of U.S. monetary policy shifts on emerging market economies (EMEs) have been a significant focus for scholars and policymakers. Recent analysis sheds light on how EMEs coped during the U.S. monetary tightening cycle spanning 2022-2023, a period marked by an unprecedented escalation in the federal funds rate. This tightening cycle was characterized by both its intensity and rapidity, leading to market expectations jumping by 4 percentage points—from late 2021 through late 2023—the most substantial alteration seen in decades.

The Impact of U.S. Monetary Policy Shifts
The tightening phase of monetary policy culminated in a cumulative increase in the federal funds rate not witnessed in the last thirty years. By 2023, growing expectations for the fed funds trajectory largely stemmed from aggressive actions taken throughout 2022. The pronounced tightening naturally raised questions about how resilient EMEs would be in response to such drastic shifts, particularly given their historical susceptibility to U.S. policy changes.
Understanding Vulnerability: The Model Framework
To analyze the outcomes, a two-country New Keynesian economic model was employed, focusing on the relationship between a “small” EME and the U.S. economy. Central to this framework were two major vulnerabilities affecting EMEs: the prevalence of foreign currency-denominated debt, which can lead to adverse impacts from domestic currency depreciation, and the imperfect anchoring of inflation expectations, a characteristic of many EMEs with histories of high inflation rates.
This model incorporated the reality that firms in these economies often rely on past inflation data for price-setting, deviating from more stable inflation expectations seen in advanced economies. Past research has indicated that the effects of monetary tightening are less damaging when provoked by strong aggregate demand rather than inflationary pressures. This suggests that even increased U.S. interest rates could be offset by positive spillover from U.S. demand.
Shifts in Growth and Monetary Dynamics
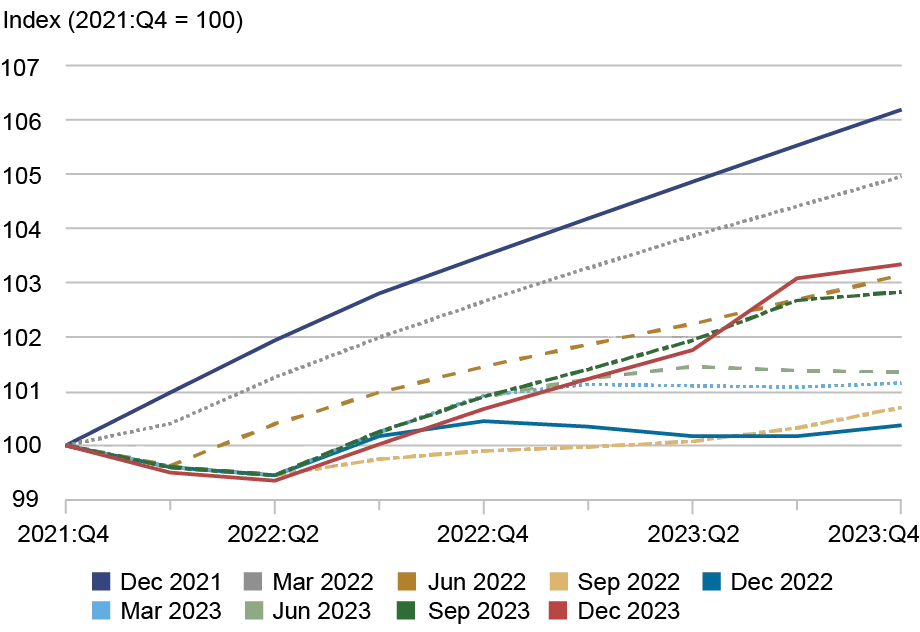
By isolating growth and monetary shocks that influenced the U.S. tightening, the model evaluated the specific impacts on EMEs. A comprehensive review of financial analysts' expectations regarding U.S. quarterly real GDP growth illustrated a continuous markdown in anticipated growth that persisted throughout 2022, even as monetary policy expectations shifted sharply upward. This scenario underscored the inflationary outlook's predominance at that time, although growth expectations showed signs of recovery starting late in 2022.
Comparing Predictions with Real Outcomes
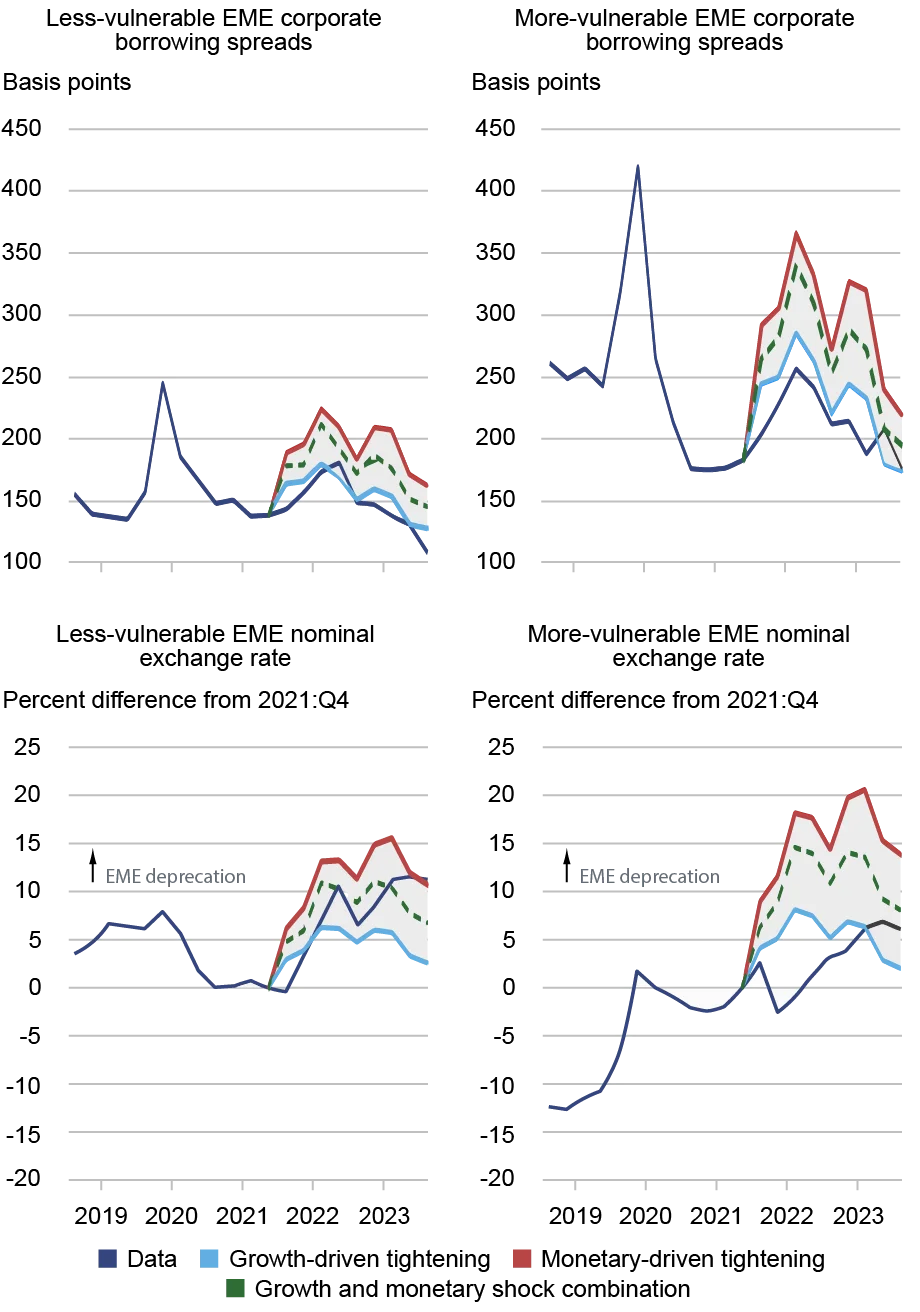
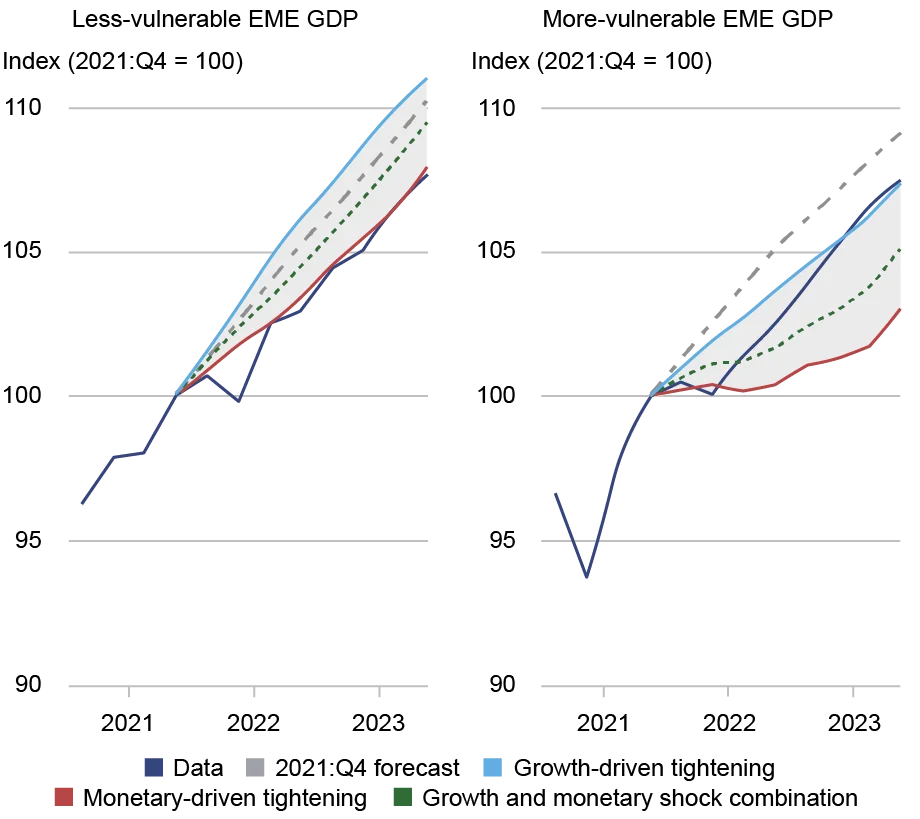
Examining both less and more vulnerable EMEs reveals how actual financial and economic indicators fared against model predictions during the tightening cycle. Analysis categorized countries into these two groups, applying a cross-country vulnerability index to assess financial impacts and economic resilience.

Data on corporate borrowing spreads and nominal exchange rates highlighted a notable divergence. For less vulnerable EMEs, exchange rates behaved closely in line with model predictions, exhibiting significant depreciation—a typical response amid tightening cycles. Conversely, corporate borrowing spreads were lower than expected based on the identified growth-monetary shock combination, aligning more with predictions derived solely from growth shocks.

For the more vulnerable EMEs, a surprising outcome became evident: financial stress was considerably less than model predictions indicated, highlighting a more favorable financial landscape than anticipated. This suggests that these economies demonstrated a degree of resilience that went beyond the original model estimates.

Examining Real Activity: GDP Findings
A similar analysis applied to real GDP output offered contrasting narratives for the two groups. The more vulnerable EMEs displayed remarkable resilience during the tightening, with GDP levels significantly exceeding model-inferred projections based on the growth-monetary shock mix. In contrast, less vulnerable economies performed poorly, with GDP levels dropping considerably below the predicted outcomes, suggesting a deeper sensitivity to the tightening environment.
Implications of Divergent Outcomes
These findings bring forth questions regarding the factors influencing the disparate outcomes for EMEs. External developments, particularly shifts in global commodity prices or economic conditions in key trading partners like China, could be pivotal in shaping the performance of these economies. Such factors, while cognizable in the broader economic landscape, were not included in the initial model framework.

Moreover, the evolution of monetary policy frameworks in these more vulnerable EMEs might have contributed positively to their resilience. A strengthening of institutional frameworks or monetary policy credibility may have played a crucial role, enabling these economies to withstand the tightening cycle more effectively than anticipated.

Conclusion and Future Considerations
The overall analysis indicates that emerging markets, despite their vulnerabilities, exhibited a greater capacity for resilience during the U.S. monetary tightening cycle than these economies would have historically suggested. While both vulnerable groups fared better in financial markets than predicted, the economic activity outcomes presented a mixed picture. Emerging market economies must remain vigilant, as the interplay of both global conditions and local policy settings will undoubtedly continue to shape their economic trajectories in future tightening scenarios. The implications of these findings suggest that additional research may be needed to better understand emerging market dynamics amidst complex global monetary environments.