Side A · Liner notes
Exploring the Surge in U.S. Revenue per Worker and Its Impact on Firm Profit Margins
Banking · Words by Christopher Martinez · Released
Since 2019, U.S. firms have seen a rise in revenue per worker, with significant implications for profit margins and the distribution of gains among stakeholders.

From 2010 to 2019, U.S. labor productivity growth showed a disappointing average increase of just 1 percent per year in nonfarm business output per hour. This stagnation was recognized as a significant downturn, particularly affecting the manufacturing sector, which faced a concurrent decline in revenue per worker among public firms. However, a turnaround began after 2019, with productivity growth accelerating to approximately 2 percent annually. This article delves into this trend, utilizing data from firm 10-K filings to analyze the surge in revenue per worker, the corresponding rise in profit margins, and the characteristics of firms that experienced these significant changes.

Productivity Trends: 2010-2025
In examining the U.S. Compustat firms from 2010 to 2025, the data is categorized into two distinct periods: before and after 2019. Sectors such as agriculture, utilities, finance, real estate, and public administration were not included due to complexities in measuring productivity in those industries. Over the 2010-2019 span, nonfarm business output per hour grew by an annual rate of 1.0 percent, but this escalated to 2.2 percent per year from 2019 onwards. A similar upward trend is observed when analyzing real revenue per worker—where sales are adjusted for industry output prices and divided by employment—growing from 0.7 percent to 2.2 percent annually during this same timeframe.
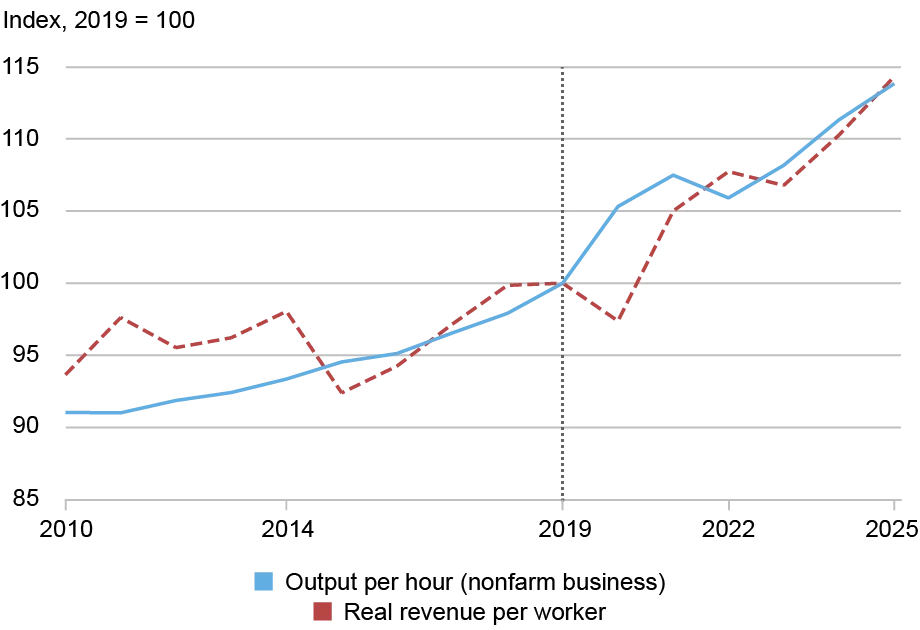
The accompanying chart illustrates these trends, depicting the synchronized increase in labor productivity and real revenue per worker among public firms starting in 2019. The substantial improvement in productivity is significant and indicates a shift in economic dynamics for many sectors.
The Profit Margin Dynamics
While understanding revenue per worker growth is crucial, it remains imperative to determine who benefits from these increases. Higher revenues could trickle down to workers through enhanced wages or could be absorbed by firms in the form of improved profit margins. This analysis investigates how profit margins have evolved from 2019 to 2025, particularly focusing on what factors may predict shifts in these margins.

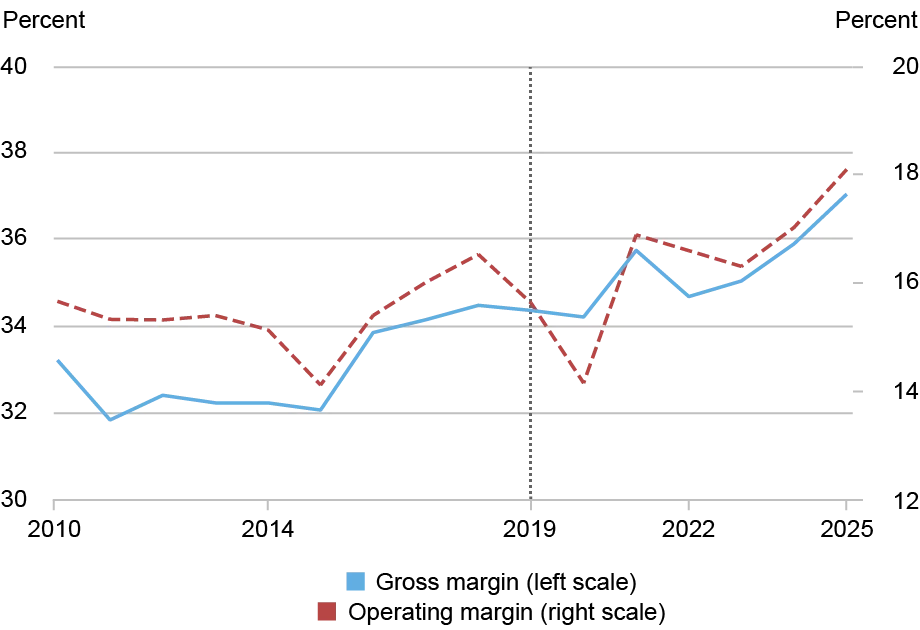
A profit margin fundamentally represents the share of revenue retained by a firm after deducting costs. Gross margins specifically account for the direct costs of production, while operating margins encompass broader expenses, including overheads like research and development (R&D). It’s pertinent to note that during the preceding decade, profit margins stagnated; gross margins featured only a marginal growth of 0.4 percent annually between 2010 and 2019, while operating margins showed minimal changes. Contrarily, since 2019, both gross and operating margins have rebounded. Gross margins have increased from about 34 percent of sales in 2019 to 37 percent in 2025, representing average growth of 1.3 percent per year. Meanwhile, operating margins climbed from 16 percent to 18 percent over the same period, reflecting an increase of 2.4 percent yearly.

Identifying Key Drivers for Profit Gain
A further inquiry into which firms recorded the most significant profit margin improvements reveals a correlation with investments in intangibles such as R&D. Prior studies have indicated that despite a slowdown in productivity growth during the 2010s, R&D investment levels in manufacturing continued on an upward trajectory. Specifically, firms with heightened R&D expenditure relative to sales were positioned to enjoy more substantial gains: for every 10 percent increase in R&D investment relative to sales in 2019, firms reported a 0.7 percent increase in operating markup growth over the subsequent years from 2019 to 2025, and a 0.5 percent increase from 2022 to 2025. In contrast, firms with higher capital intensity did not see similar benefits, suggesting that returns linked to intangible investments—like technology and innovation—play a vital role in marking up profit margins.

Measured productivity metrics have demonstrated a marked improvement post-2019 across both aggregated and firm-level data, effectively ending a decade-long streak of slow growth. Alongside this productivity surge has been a notable increase in profit margins, where operating margins have shown an average rise of over 2 percent per year from 2019 to 2025. The correlation of higher R&D expenditure with profit margin growth indicates a shift towards valuing investments in technology and intangibles. As firms adapt to changing market conditions and harness the potential of innovative capabilities, it remains to be seen whether these rising margins reflect just a temporary windfall for firms or the sustained returns of significant intangible investments.

The evolving landscape of productivity and profit margins will require ongoing monitoring to ascertain the long-term impacts on various stakeholders, including employees, shareholders, and consumers. With labor market conditions affecting wage dynamics, understanding this complex interplay will be critical for future economic assessments.