Side A · Liner notes
Evaluating the Persistence of Seasonal Trends in U.S. Monetary Policy
Banking · Words by David Rodriguez · Released
Recent analysis reveals that U.S. monetary policy continues to exhibit seasonal patterns, driven primarily by the scheduling of FOMC meetings.
In a comprehensive reevaluation of U.S. monetary policy over the prior twenty-five years, authors Richard Crump, Keshav Dogra, and Dennis Kongoli have confirmed that the seasonal behavior of Fed interest rate adjustments remains intact, though largely attributable to the scheduling of Federal Open Market Committee (FOMC) meetings. This analysis builds upon a 2012 post from Liberty Street Economics that first identified these seasonal trends.
Historical Context
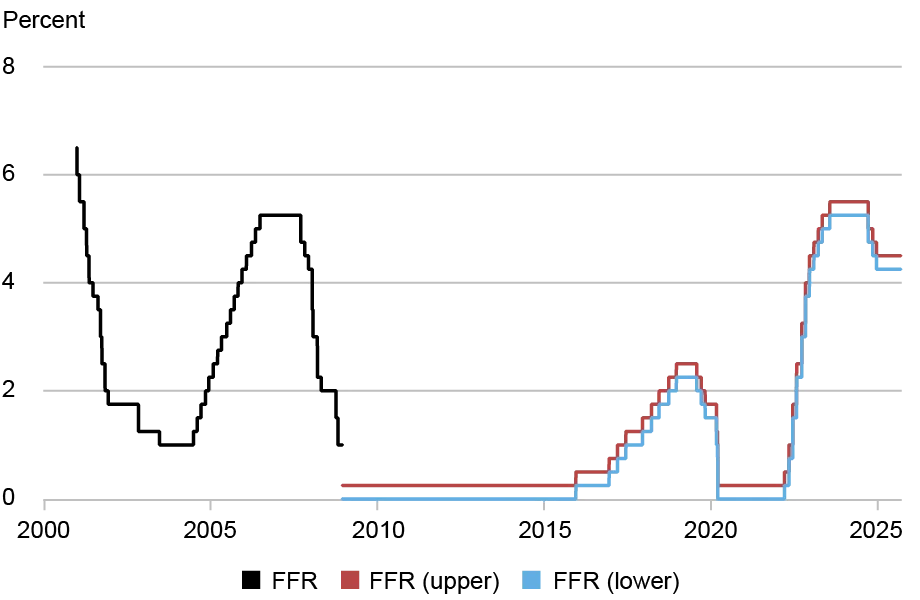
The study spans from January 2000 to July 2025, capturing essential shifts in monetary policy. Notably, prior to October 2008, the FOMC communicated a target for the federal funds rate, which transitioned to a target range post-crisis. The federal funds rate spent six years anchored at zero following the 2008 financial crisis, reflecting a reaction to unprecedented economic conditions. Rate adjustments in the U.S. illustrate the central bank's efforts to navigate turbulent waters; the funds rate experienced a moderate increase during the late 2010s, but was then pushed back to the zero lower bound during the COVID-19 pandemic, illustrating the gravity of that global health crisis. Subsequently, significant rate hikes commenced in 2022, driven by inflationary pressures that emerged alongside the recovery. Against this backdrop, the net decline of 125 to 150 basis points since 2000 starkly contrasts with the 600 basis point slide seen in the earlier period of 1987-2008, raising questions about the long-term effectiveness of recent monetary policies.
Seasonal Patterns Identified
Despite the considerable macroeconomic shifts over the last two decades, the FOMC’s decisions regarding the federal funds rate have largely followed the same seasonal behavior identified in earlier investigations. Analysis indicates that reductions in the federal funds target are disproportionately observed during the first month of each quarter, while increases are mostly concentrated in the second and third months. This dynamic can be visualized through scatter plots showing the frequency of rate changes over time, which clearly illustrate the correlation between meeting schedules and policy shifts. It's fascinating how even with fluctuating economic conditions and unforeseen crises, the timing of these meetings can seem almost preordained.

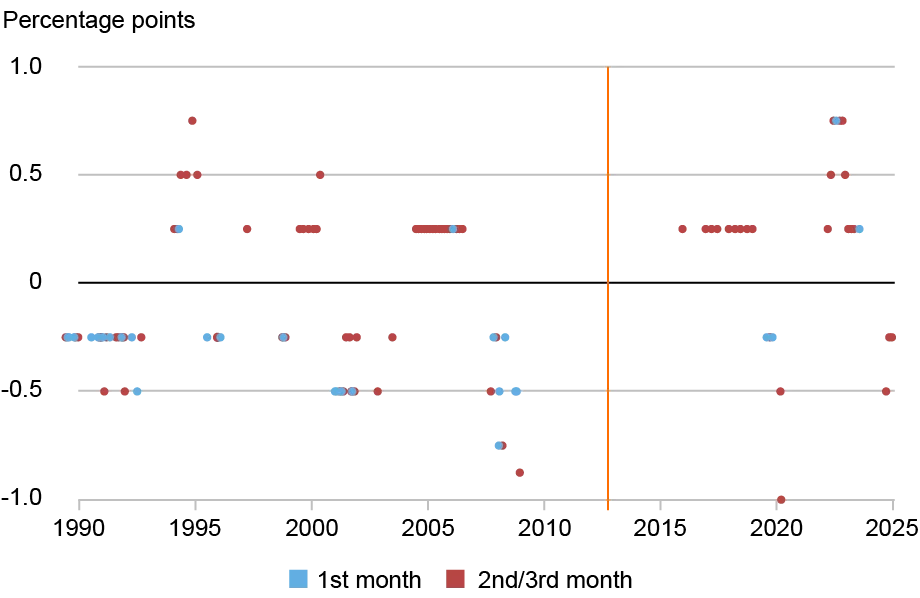
From the accumulated data, researchers observed that, between 2000 and 2024, the federal funds rate saw a total decline of 4 percentage points during first-month meetings of each quarter, contrasted by an almost 3 percentage point increase in rate changes during the rest of the year. Specifically, after the 2012 post, the rate moved up by 50 basis points in the first month of quarters, juxtaposed with a cumulative increase of 375 basis points at other times. The timing of these adjustments could suggest a broader strategy at play, where the FOMC's operational calendar influences financial markets' expectations, which further impacts economic stability.

Statistical Analysis of FOMC Decision Scheduling
The original post suggested that the apparent seasonality could potentially stem from the coincidence of FOMC meeting timing with rate adjustments. Historical data reveals that more meetings aligned with easing cycles occurred in the first month of each quarter from 1987 to 2008, marking a clear pattern. Even when filtering out outlier years, such as those with exceptionally few or numerous meetings, these seasonal behaviors remained statistically significant. This consistency only adds weight to the argument that the FOMC's structured schedule inherently influences monetary policy decisions.

This recent study further advanced the investigation by considering a counterfactual scenario where annual changes in the federal funds rate would be evenly distributed across all scheduled meetings of the year. During this analysis, findings displayed a notable 306 basis point decline in the first month of the quarter, starkly contrasted by a 193 basis point increase in other months. This differential is striking and indicates substantial persistence of seasonal behavior, suggesting that while scheduled meetings do play a role, they are not the sole determinant of rate dynamics.
| Year | Total Change | 1st Month of Quarter | 2nd/3rd Months of Quarter |
|---|---|---|---|
| 2000 | 1.00 | 0.00 | 1.00 |
| 2001 | -4.75 | -2.00 | -2.75 |
| 2002 | -0.50 | 0.00 | -0.50 |
| 2003 | -0.25 | 0.00 | -0.25 |
| 2004 | 1.25 | 0.00 | 1.25 |
| 2005 | 2.00 | 0.00 | 2.00 |
| 2006 | 1.00 | 0.25 | 0.75 |
| 2007 | -1.00 | -0.25 | -0.75 |
| 2008 | -4.13 | -2.50 | -1.63 |
| 2015 | 0.25 | 0.00 | 0.25 |
| 2016 | 0.25 | 0.00 | 0.25 |
| 2017 | 0.75 | 0.00 | 0.75 |
| 2018 | 1.00 | 0.00 | 1.00 |
| 2019 | -0.75 | -0.50 | -0.25 |
| 2020 | -1.50 | 0.00 | -1.50 |
| 2022 | 4.25 | 0.75 | 3.50 |
| 2023 | 1.00 | 0.25 | 0.75 |
| 2024 | -1.00 | 0.00 | -1.00 |
| Total | -1.13 | -4.00 | 2.88 |
| Since 2012 | 4.25 | 0.50 | 3.75 |
Implications and Future Outlook
This inquiry into monetary policy seasonality suggests that while the timing of FOMC meetings heavily influences rate changes, an element of inherent seasonal behavior remains evident. This is more significant than it looks. Understanding these patterns can help investors, analysts, and policymakers identify ideal moments for strategic planning or anticipate potential fluctuations in interest rates. The resonance of these findings points to a historical inertia that could complicate efforts to adjust monetary policy dynamically.

Crucially, the “excess seasonality” previously observed appears not to extend beyond 2012, as statistical analysis now aligns closely with FOMC meeting scheduling. For those in the industry, this means that the expected behavior of interest rates may be more predictable than previously thought. As the economy grapples with new challenges, such as evolving inflation patterns and international trade dynamics, the need to keep an eye on these seasonal patterns will be paramount.

The ongoing examination of FOMC rate decisions may illuminate further dynamics of monetary policy, especially as new economic paradigms emerge. After all, shifts in economic outlooks will undoubtedly have ramifications on rate decisions, but understanding the ingrained seasonal behaviors of FOMC meetings will also be pivotal. If you’re working in this space, you’ll need to stay attuned to how these nuances in seasonal behavior can provide strategic advantages in forecasting economic movements.